Discover The Leading Theme With GICS Rankings: Global Industry Classification Standard Ranked
Deepvue
Last Updated:
July 11, 2025
What are the GICS rankings?
The Global Industry Classification Standard (GICS) is a system that helps organize public companies based on what they actually do. The GICS breaks the market down into 11 sectors, 25 industry groups, 75 industries, and 163 sub-industries.
This classification system gives investors a clear way to compare companies in the same space. For example, if you’re looking at tech stocks, GICS helps you know whether you’re comparing a software company to another software firm, or to a completely different type of tech business like semiconductors.
When we talk about GICS rankings, we’re looking at how well each of these classifications, like sectors or industries, is performing. Basically, it’s a way to see which parts of the market are leading and which might be lagging.
GICS rankings can help you tune into the leading themes of every market cycle.
What are the GICS Classifications?
GICS uses a four-tier system to sort companies, starting broad and getting more specific. Here’s a quick breakdown:
- Sectors (11 total): These are the big-picture categories, like Information Technology, Healthcare, Energy, and Financials. Each sector groups companies that share broad business themes.
- Industry groups (25 total): These break sectors into more specific categories. For example, inside the Information Technology sector, you’ll find groups like “Software” and “Semiconductors & Semiconductor Equipment.”
- Industries (75 total): This level narrows it down even more. Within the “Software” group, you might see industries like “Application Software” and “Systems Software.” This helps investors zoom in on more focused parts of the market.
- Sub-industries (163 total): These are the most detailed classifications. For instance, within “Application Software,” you could find sub-industries like “Cybersecurity” or “Enterprise Resource Planning Software.” This level is perfect for spotting niche trends, like the rise of AI-driven analytics or cloud-based tools.
Each tier in the GICS structure lets you analyze the market from a different angle.
If you want to track how tech is doing overall, look at the sector level. If you want to invest in a growing trend like cybersecurity, drill down to the sub-industry level.
But the real power comes from GICS rankings. These rankings show you which sectors, industries, or sub-industries are outperforming or underperforming, based on stock performance metrics. It’s like having a scoreboard for the entire market.
Why understanding the GICS rankings matters
GICS rankings aren’t just about tracking which sectors are up or down. They help you cut through the market noise and focus on where the real action is.
By following GICS rankings, you’re identifying where capital is flowing, where investor sentiment is shifting, and where the next breakout might come from. That kind of insight can give you an edge, whether you’re building a diversified portfolio or hunting for short-term plays.
💡 Pro Tip: Top-performing stocks typically are in a strong-performing group. During every market cycle, look for the leading stock in the leading group.
Following the leading industries can also help identify the leading stocks. Strong sectors often lift the top-performing companies within them.
So, when you spot a sector or sub-industry climbing the ranks, it’s a good time to look for standout stocks in that group.
How the GICS ratings help find strong stocks
Stocks in leading groups consistently outperform. Once a leading theme is identified, always look for the leading stock in that group.
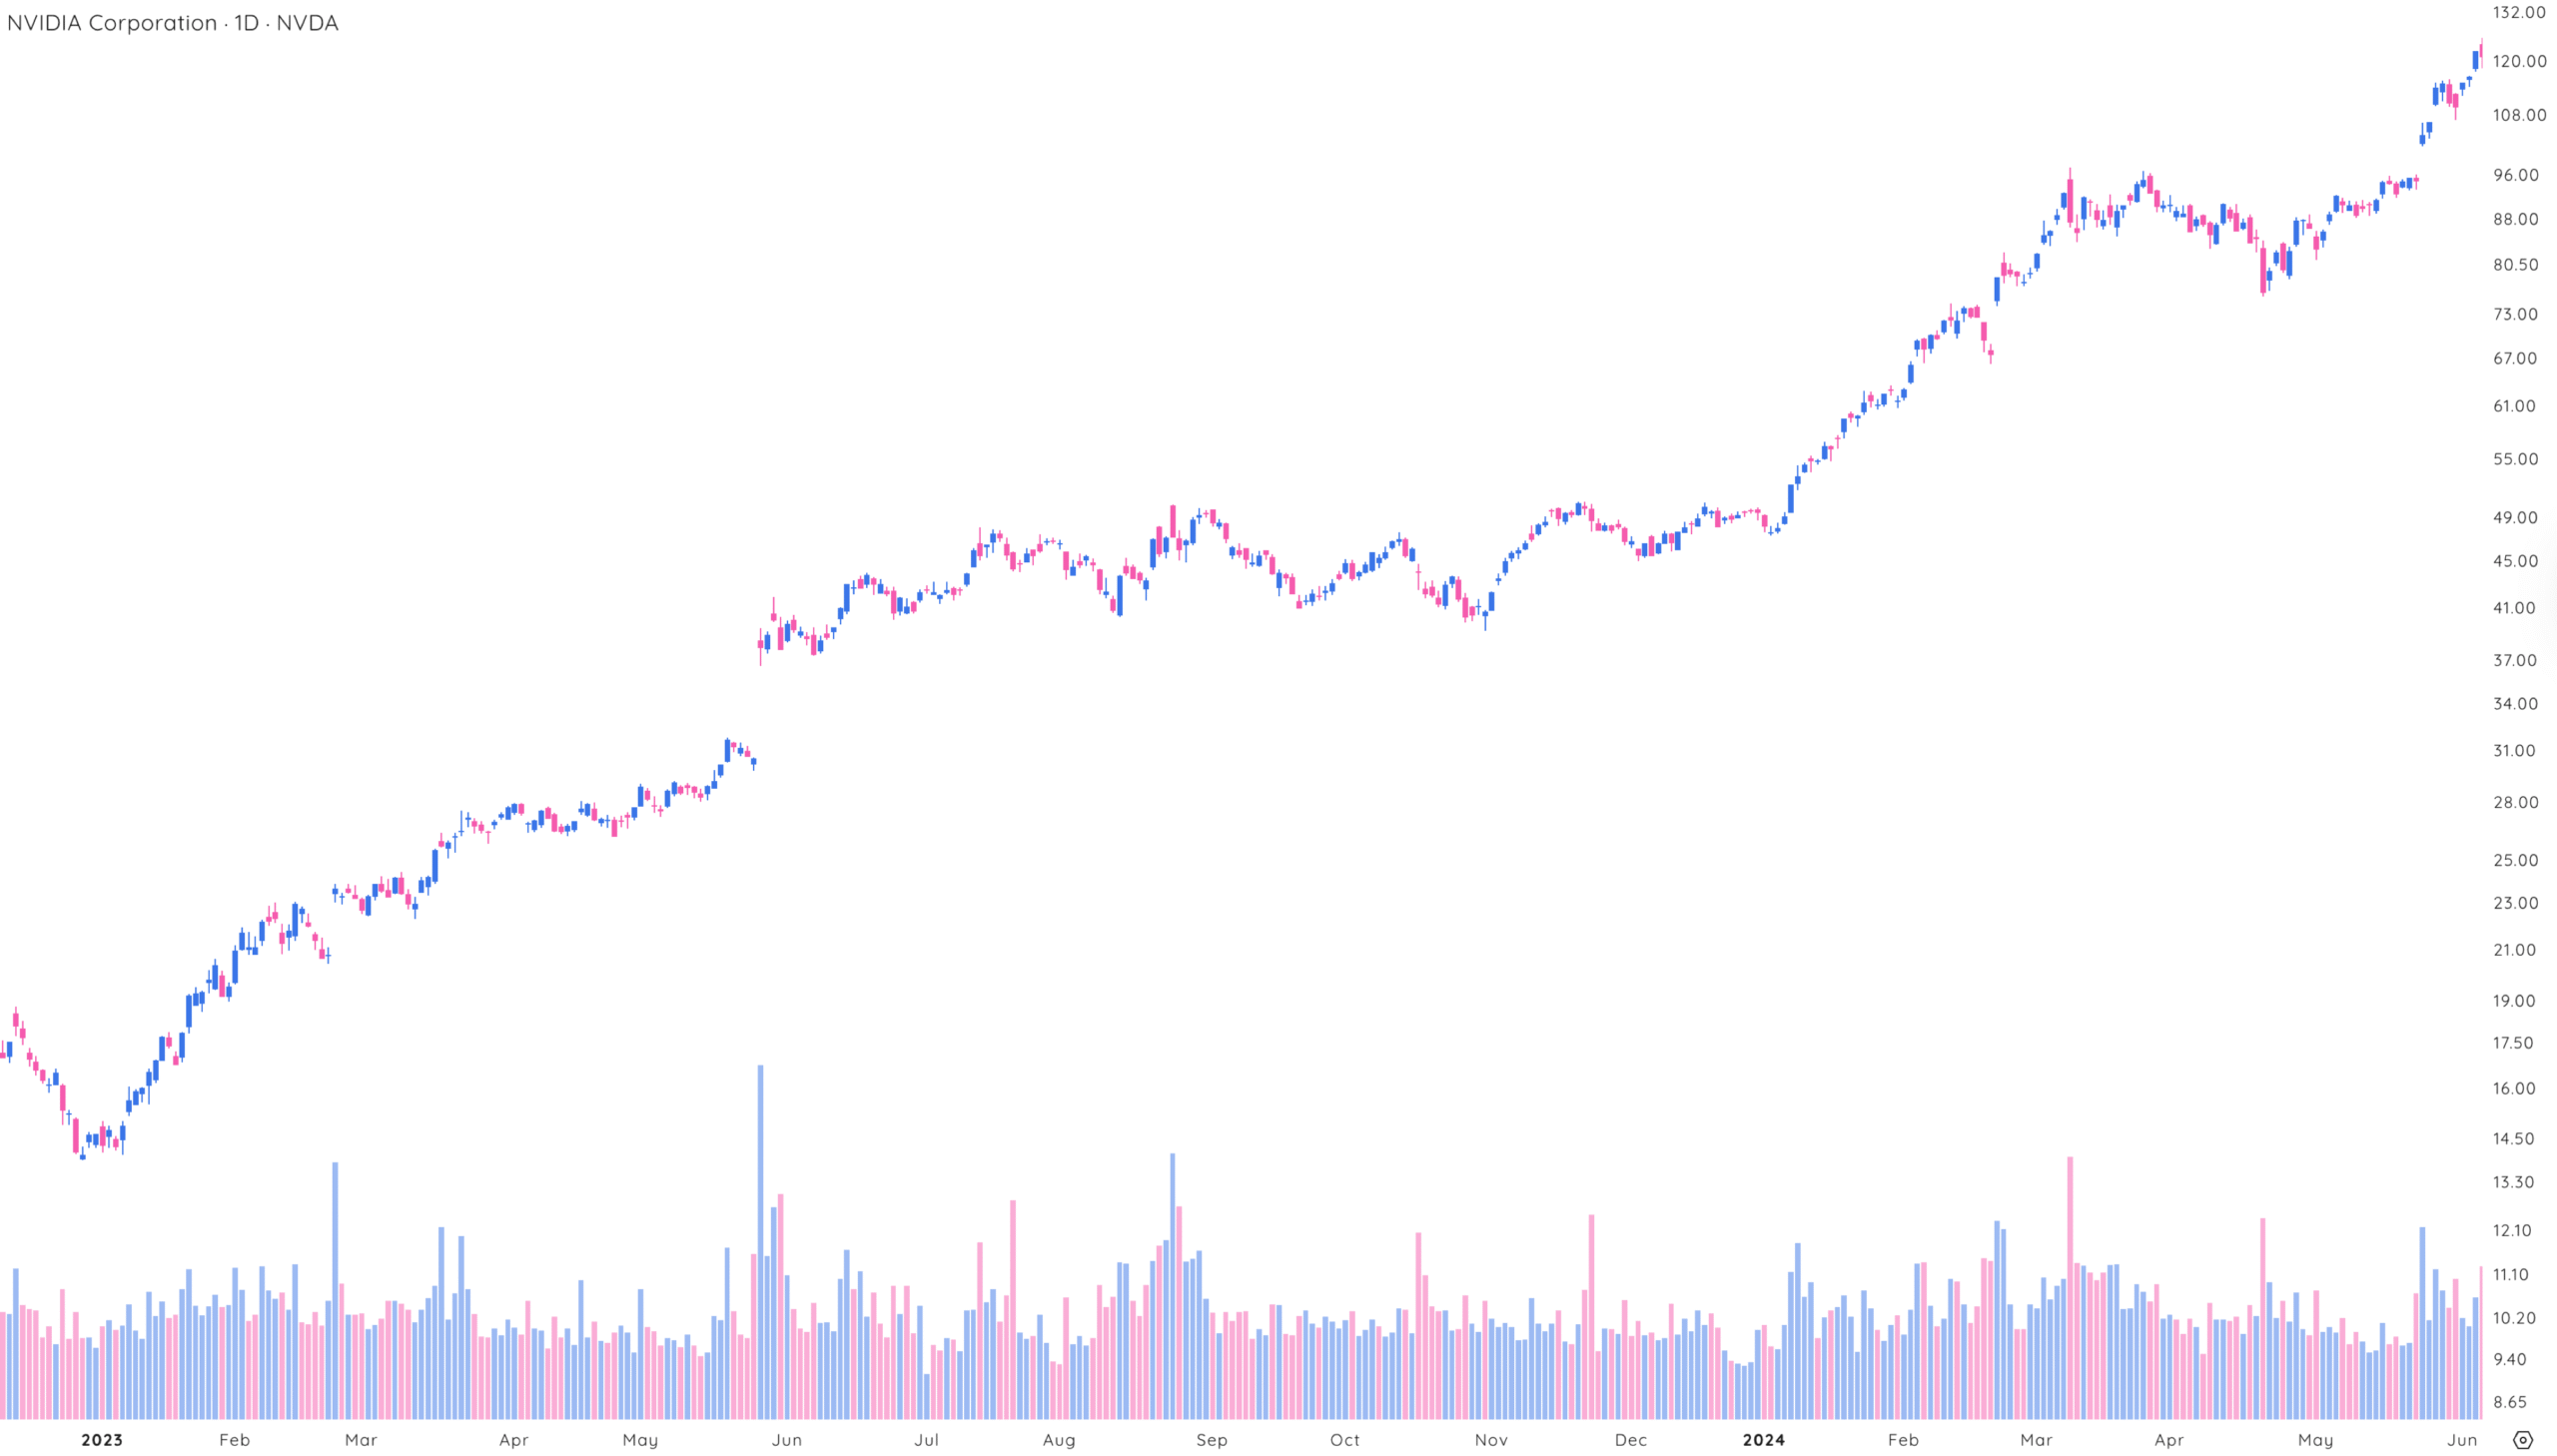
Off the lows after the 2022 bear market, semiconductors led the market higher. NVDA, leading stock at that time, advanced almost 1,000% in two years.
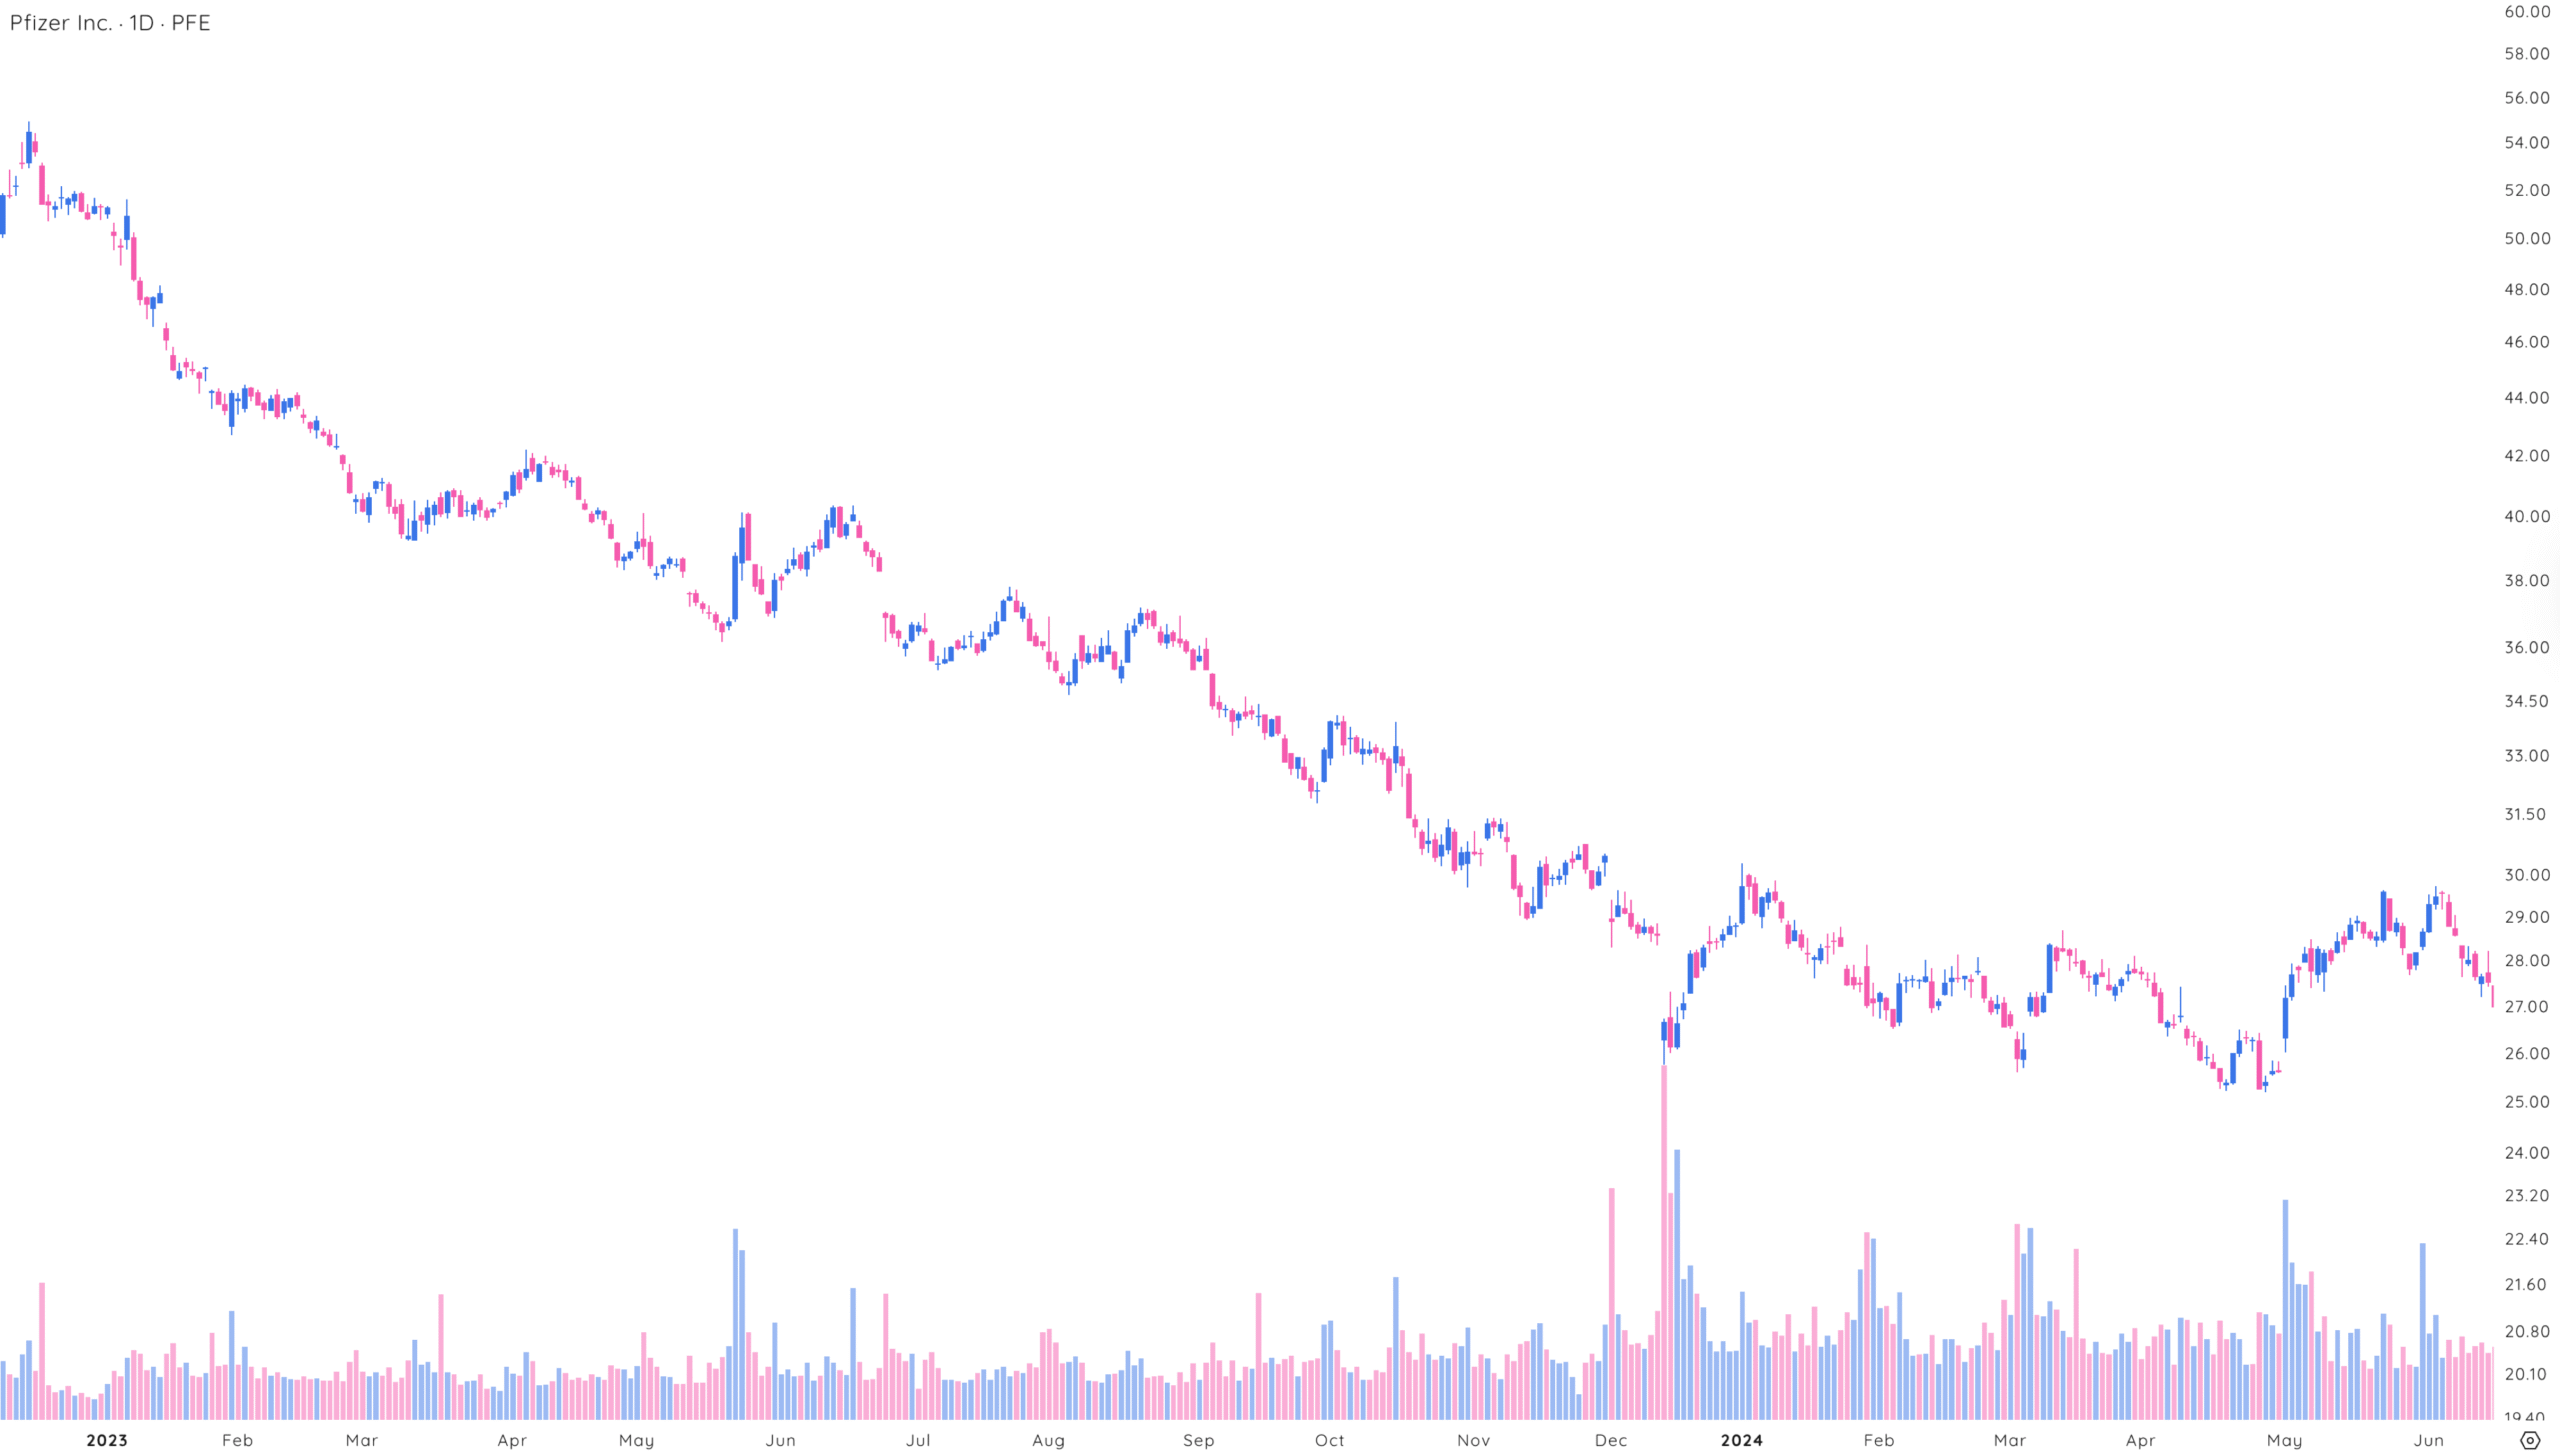
Alternatively, poor ranking groups underperformed the market. Stocks that were part of worse worst-performing groups failed to see accumulation in a strong bull market.
The lagging healthcare sector had many weak stocks trending lower during the same time period.
Identifying strength on your watchlist
By understanding and utilizing GICS rankings, investors can target stocks part of outperforming groups that are likely to outperform the market. These rankings aid in identifying groups that are leading the market.
Adding GICS rankings to your data panel
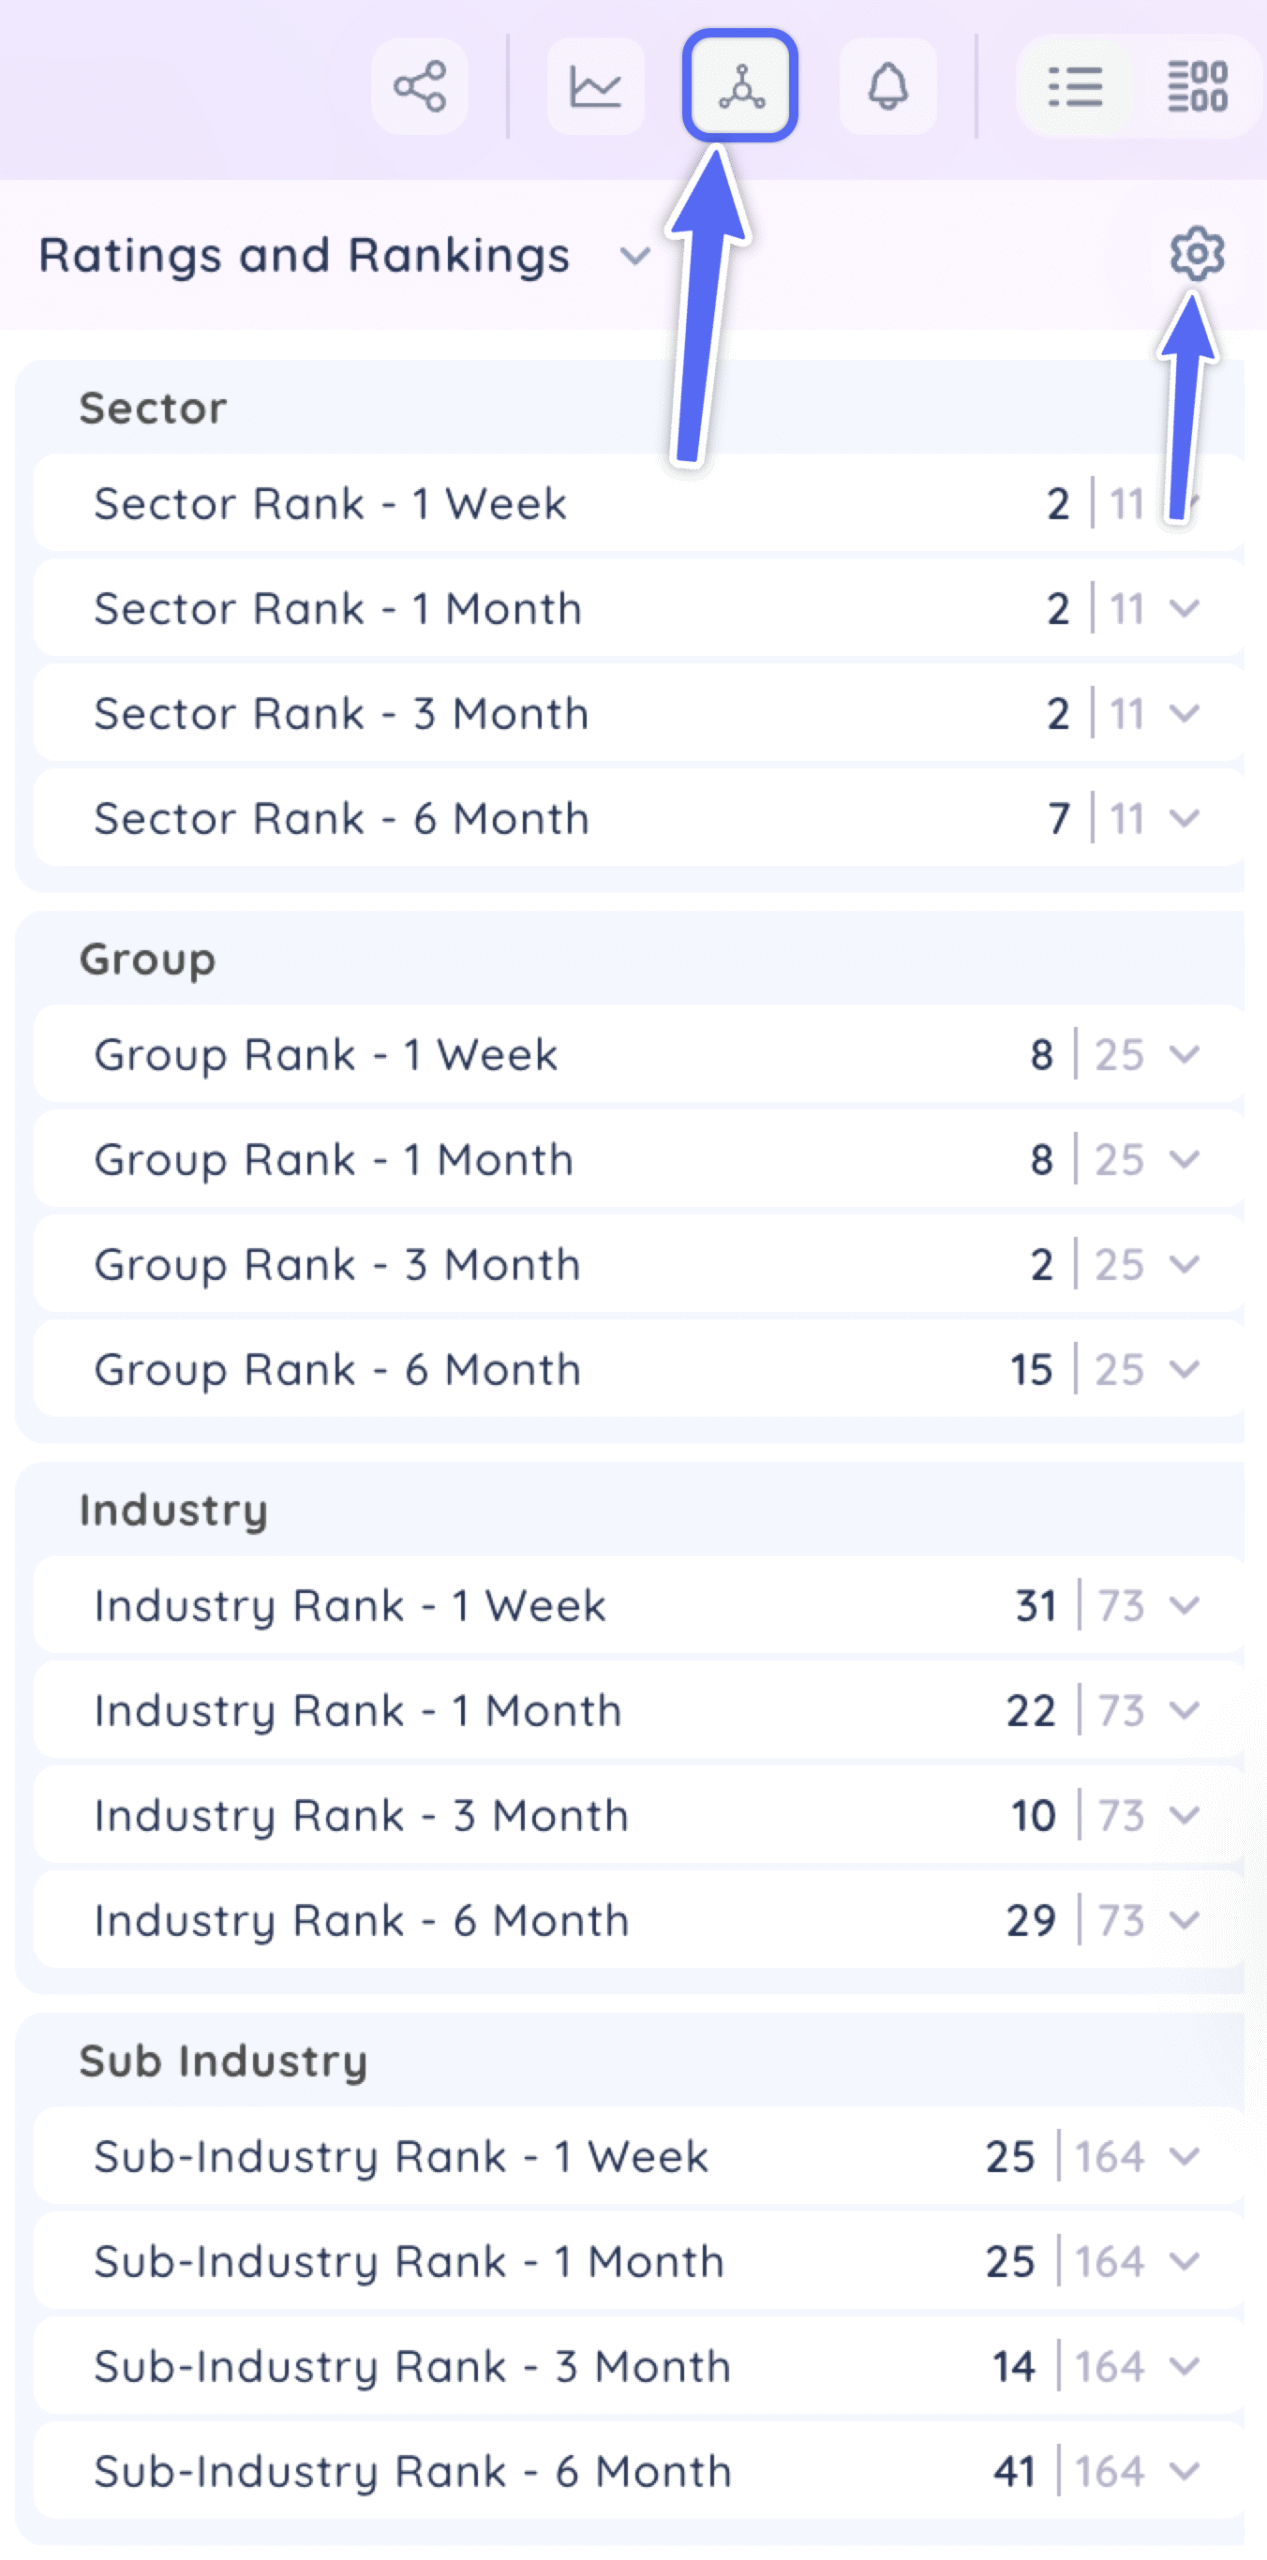
Click on the Data Panel Icon to open all customizable settings.
To optimize your trading strategy, design a tailored Data Panel focused on composite ratings. Here’s how you can customize it:
- Select Your Timeframe: Adjust the periods for which you want to analyze the GICS rankings. This flexibility allows you to align the rankings with your trading horizon, whether you’re a day trader, swing trader, or long-term investor, by focusing on 1 month or multiple months.
- Integration With Your Trading Strategy: If your strategy involves other factors like volume, volatility, or fundamental data, integrate these rankings into your data panel alongside other performance metrics.
Adding GICS rankings to your column settings
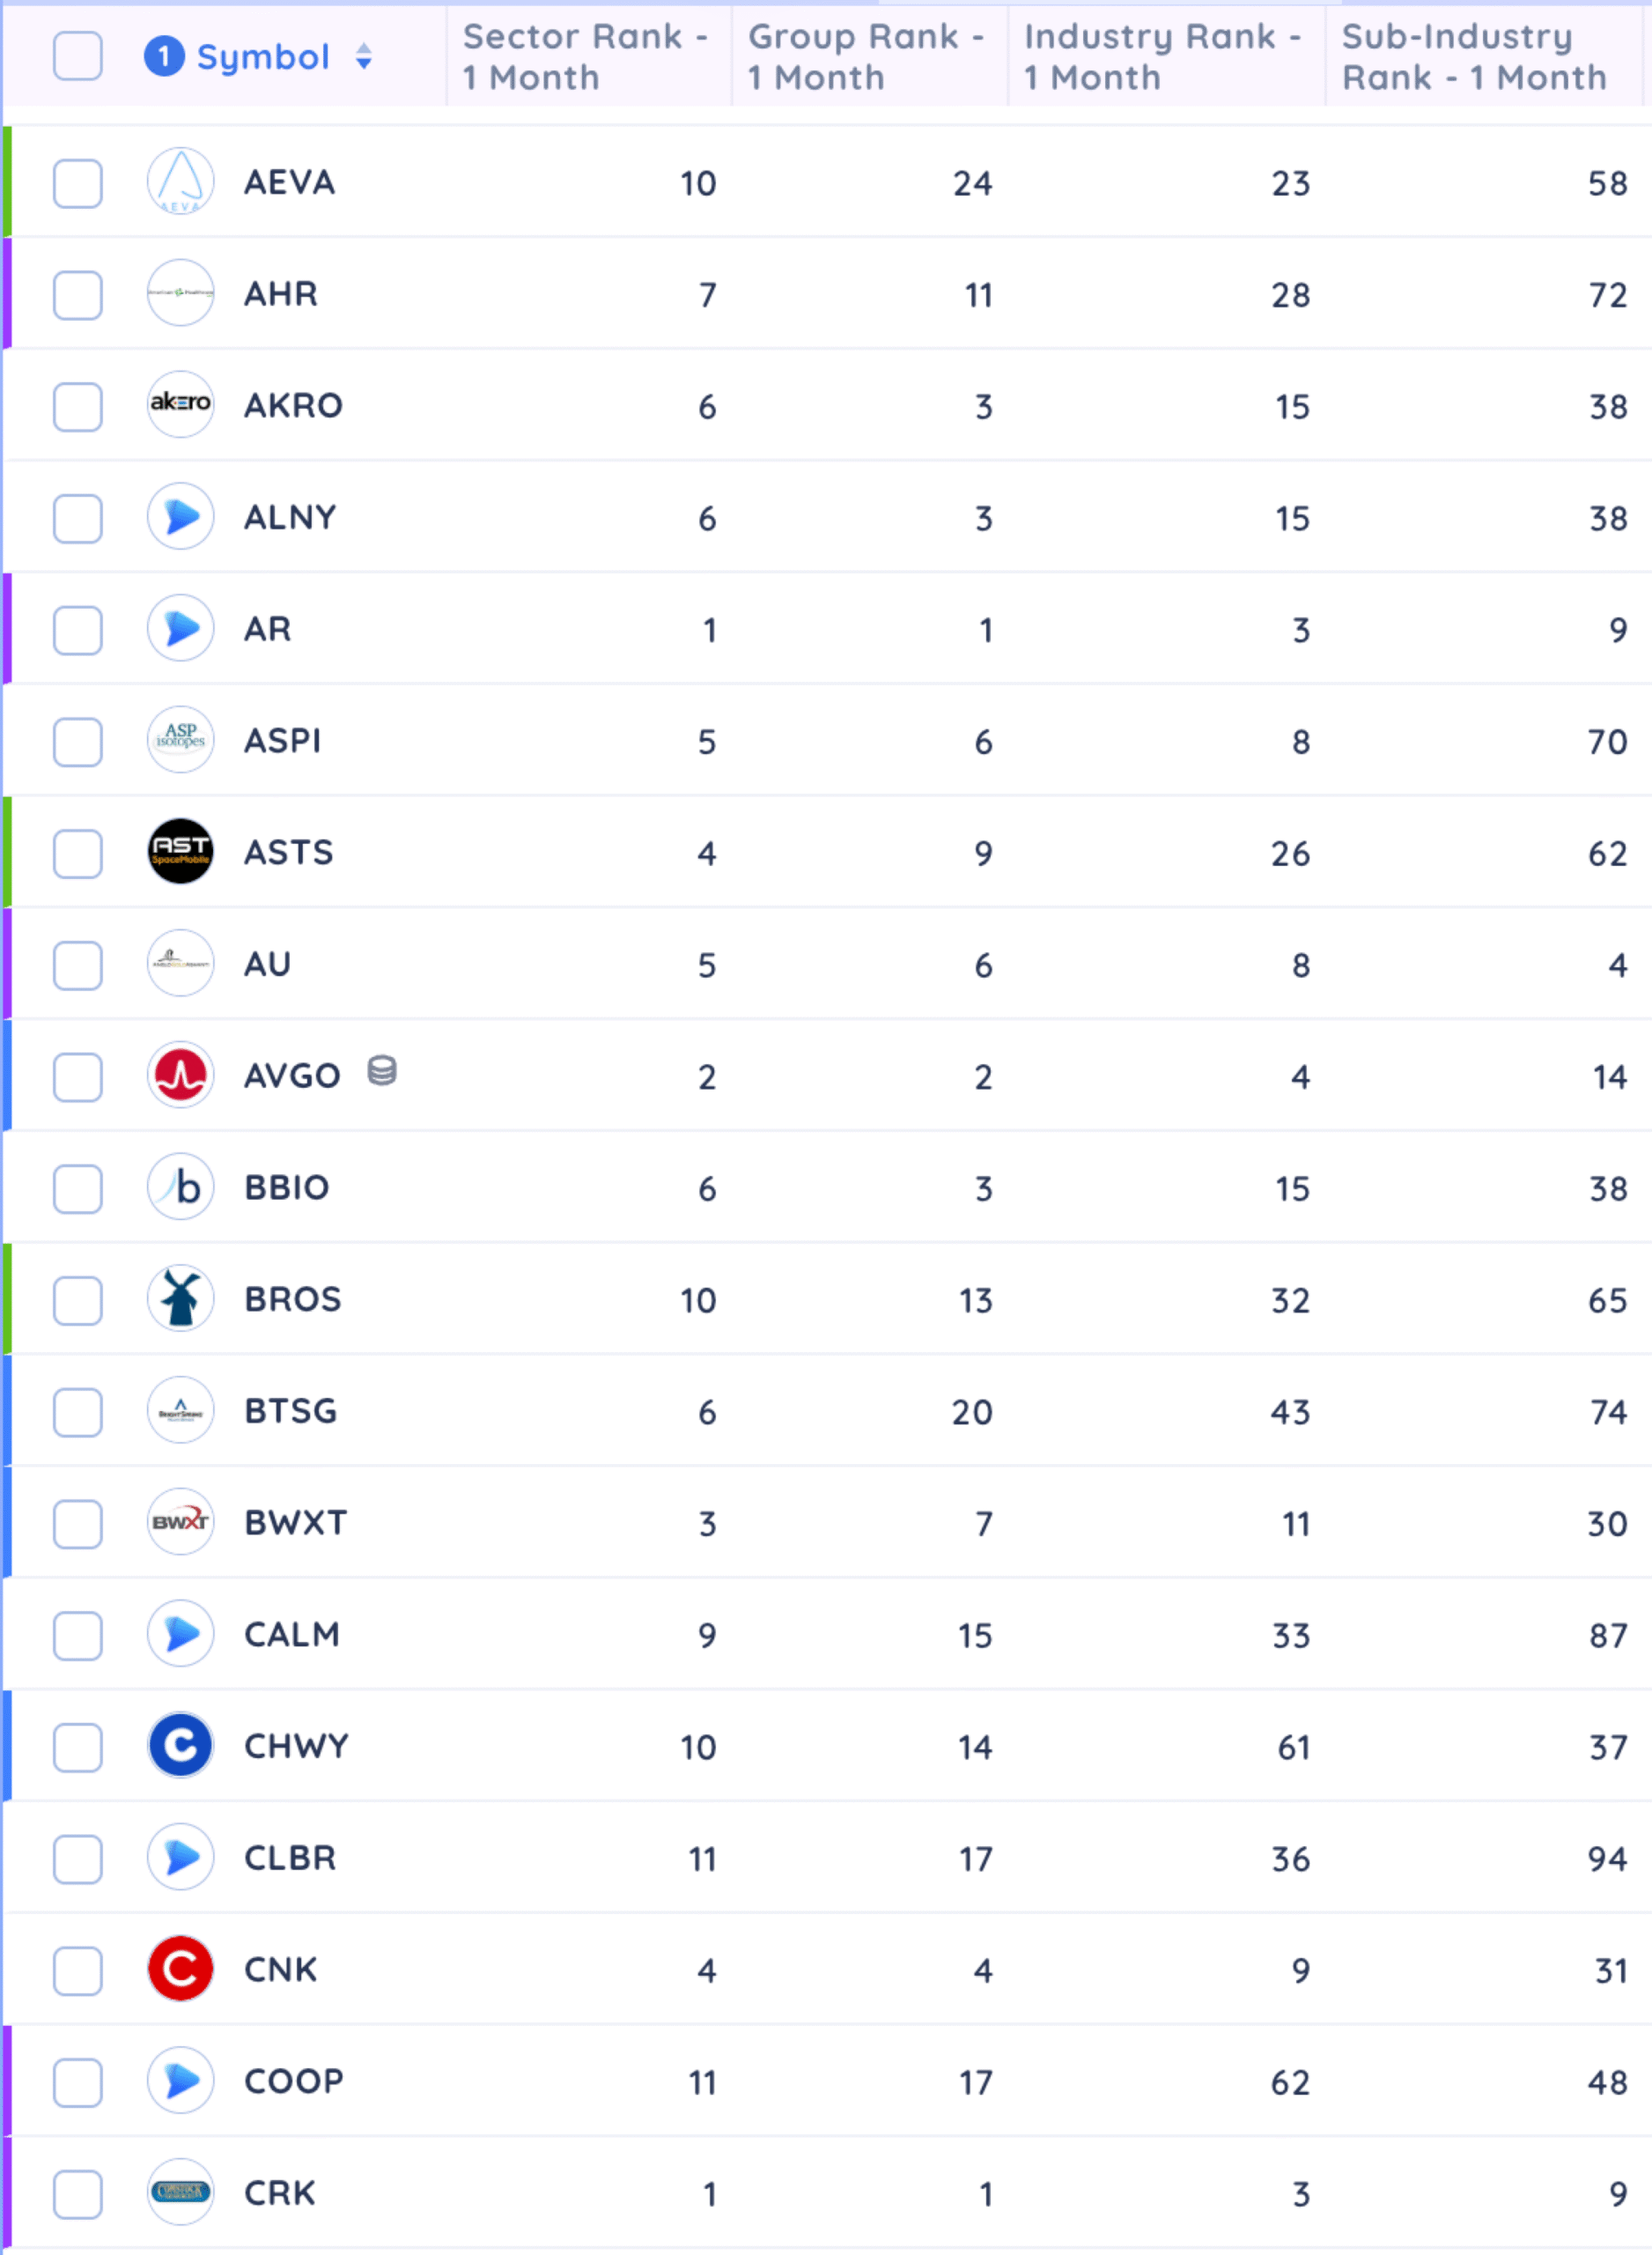
In a similar fashion to the Data Panel, Deepvue users can create custom Column Settings to tailor to their needs.
To enhance your trading approach, create a custom Data Panel centered on GICS rankings. Here’s how you can adapt it to your needs:
- GICS Comparisons: Compare how the Sector is related to the group, industry, and sub-industry rankings. The closer to the top ranking across all classifications, the better.
- Compare Other Ratings: Incorporate the relative strength and absolute strength rankings to quickly find the stand-out performers.
- Add Other Momentum Indicators: Create a quick visual for analyzing the strength of a stock’s trend. Add Daily and Weekly Closing Ranges, Volume Run Rate, and other Industry Rankings.
Personalizing your Data Panel and Column Settings with these elements enables powerful tools at your fingertips to help identify the best stocks by focusing on strength. With these personalized settings, your dynamic workspace helps quickly filter stocks to easily analyze and react to stock performance trends.
How to find strong stocks: screening with GICS rankings
Whether you’re a new investor or an experienced trader, understanding the different GICS rankings can help you uncover the leading theme. Incorporate the GICS rankings into your screening routine to ensure you are looking at groups that are outperforming the market.
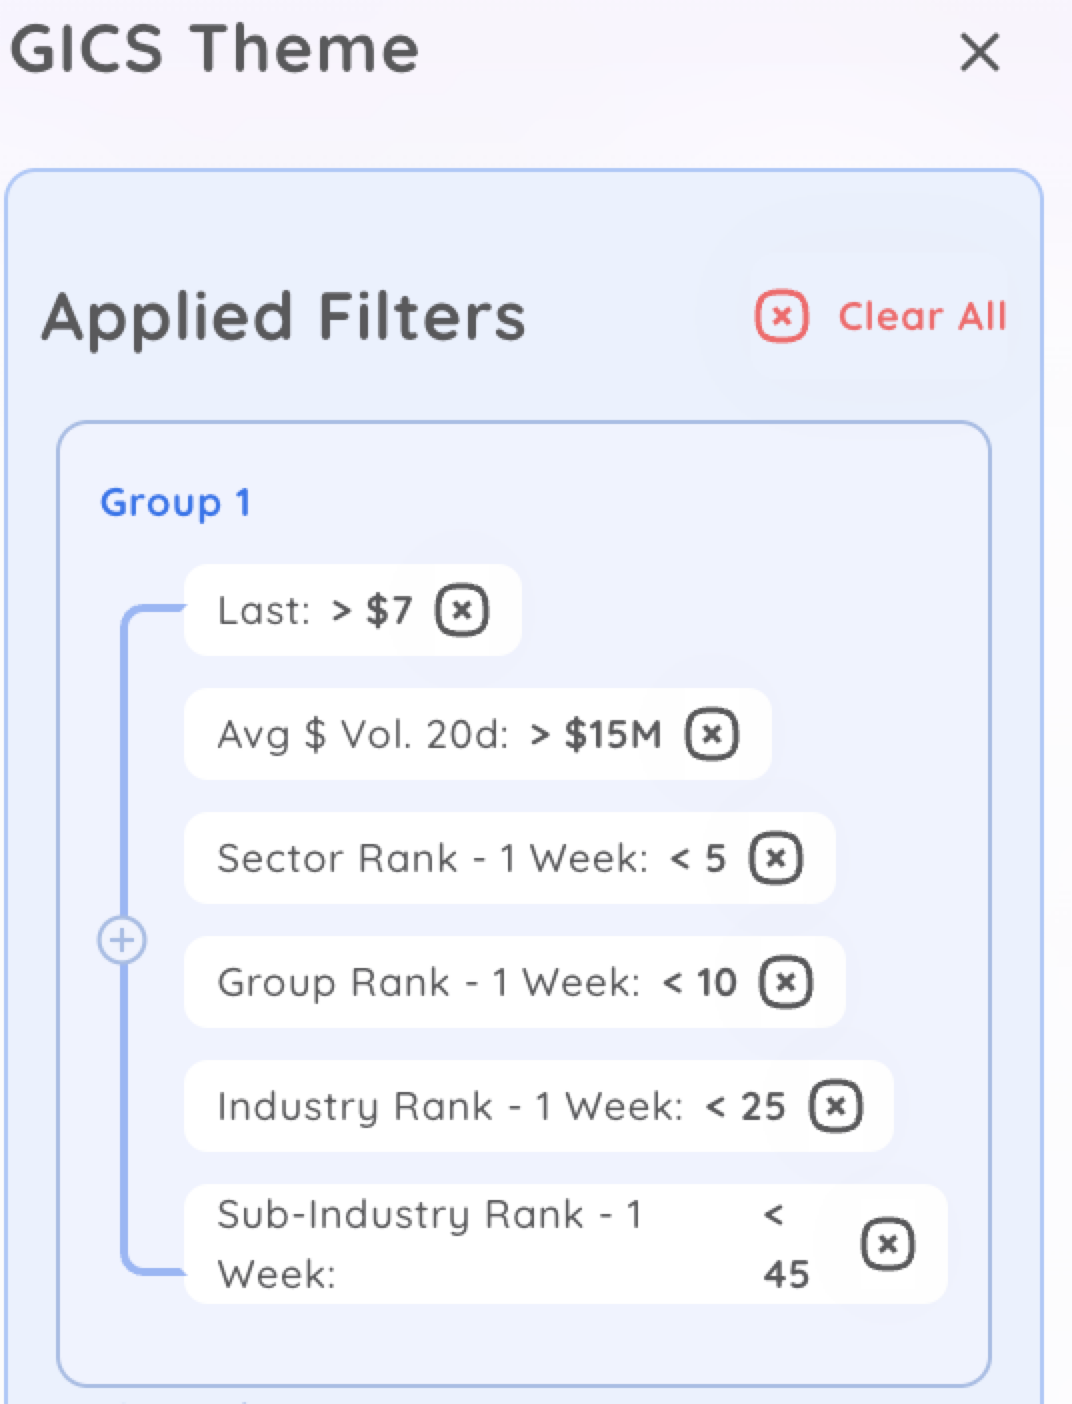
Include basic liquidity criteria when looking for stocks with top-tier GICS rankings.
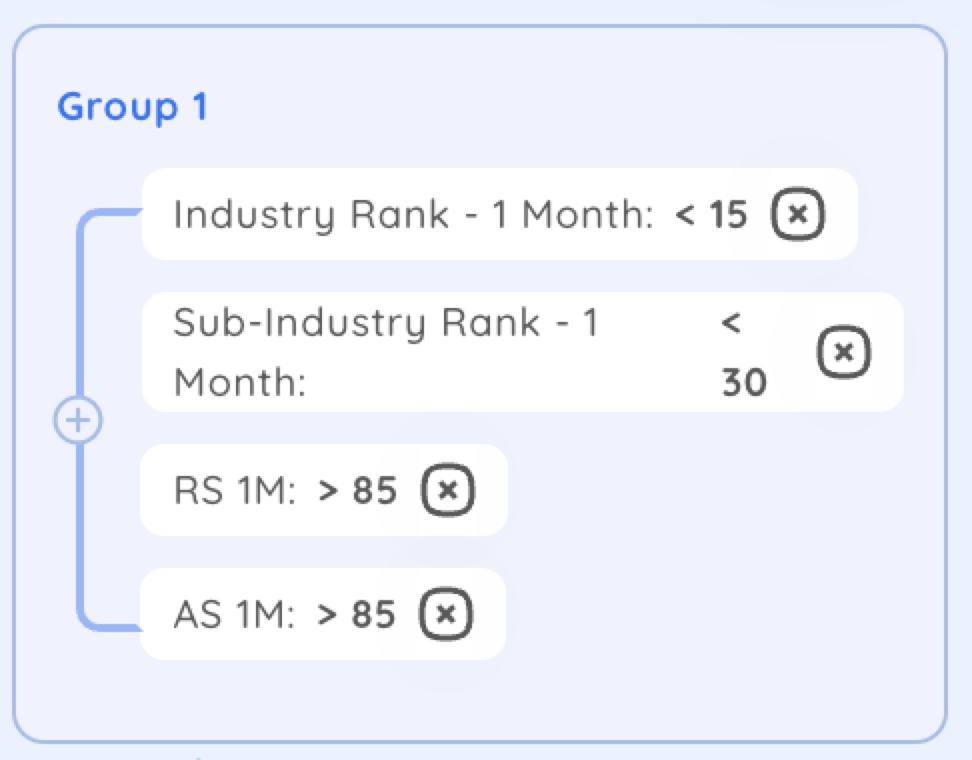
Include other ratings and rankings like Relative Strength and Absolute Strength within the top sub-industries.
Key takeaways: Why finding the leading theme helps uncover the leading stock
GICS rankings give you a structured way to break down the market and focus on where the real strength is happening – across sectors, industry groups, and sub-industries.
By following these rankings, you’re tracking momentum, spotting leadership, and uncovering where investors are putting their money right now. That’s the kind of insight that can help you stay ahead of the curve and avoid chasing stocks in weak, lagging areas of the market.
When you consistently target the strongest groups, you dramatically increase your chances of finding stocks that outperform. Just like NVDA thrived as semiconductors led the market higher, other winners will always emerge from leading sectors in future cycles.
So, whether you’re screening for trade setups, customizing your data panels, or building long-term watchlists, let GICS rankings guide your focus. They’re your roadmap to finding the right stocks at the right time.


