What is the RS Rating?
Key Takeaways: Harnessing The Absolute Strength Rating
Volume Profile maps the votes. Not the loud ones (price spikes), but the meaningful ones—volume stacked at price. It tells you where the crowd agreed, where it fought, and where it couldn’t care less.
Forget bottom-of-the-chart volume bars. This is price-based, not time-based. It’s a horizontal histogram that shows how much volume was traded at each price level, not when.
It’s like x-ray vision for supply and demand. And once you understand it, you stop chasing price and start trading structure.
Key Terms You’ll Actually Use
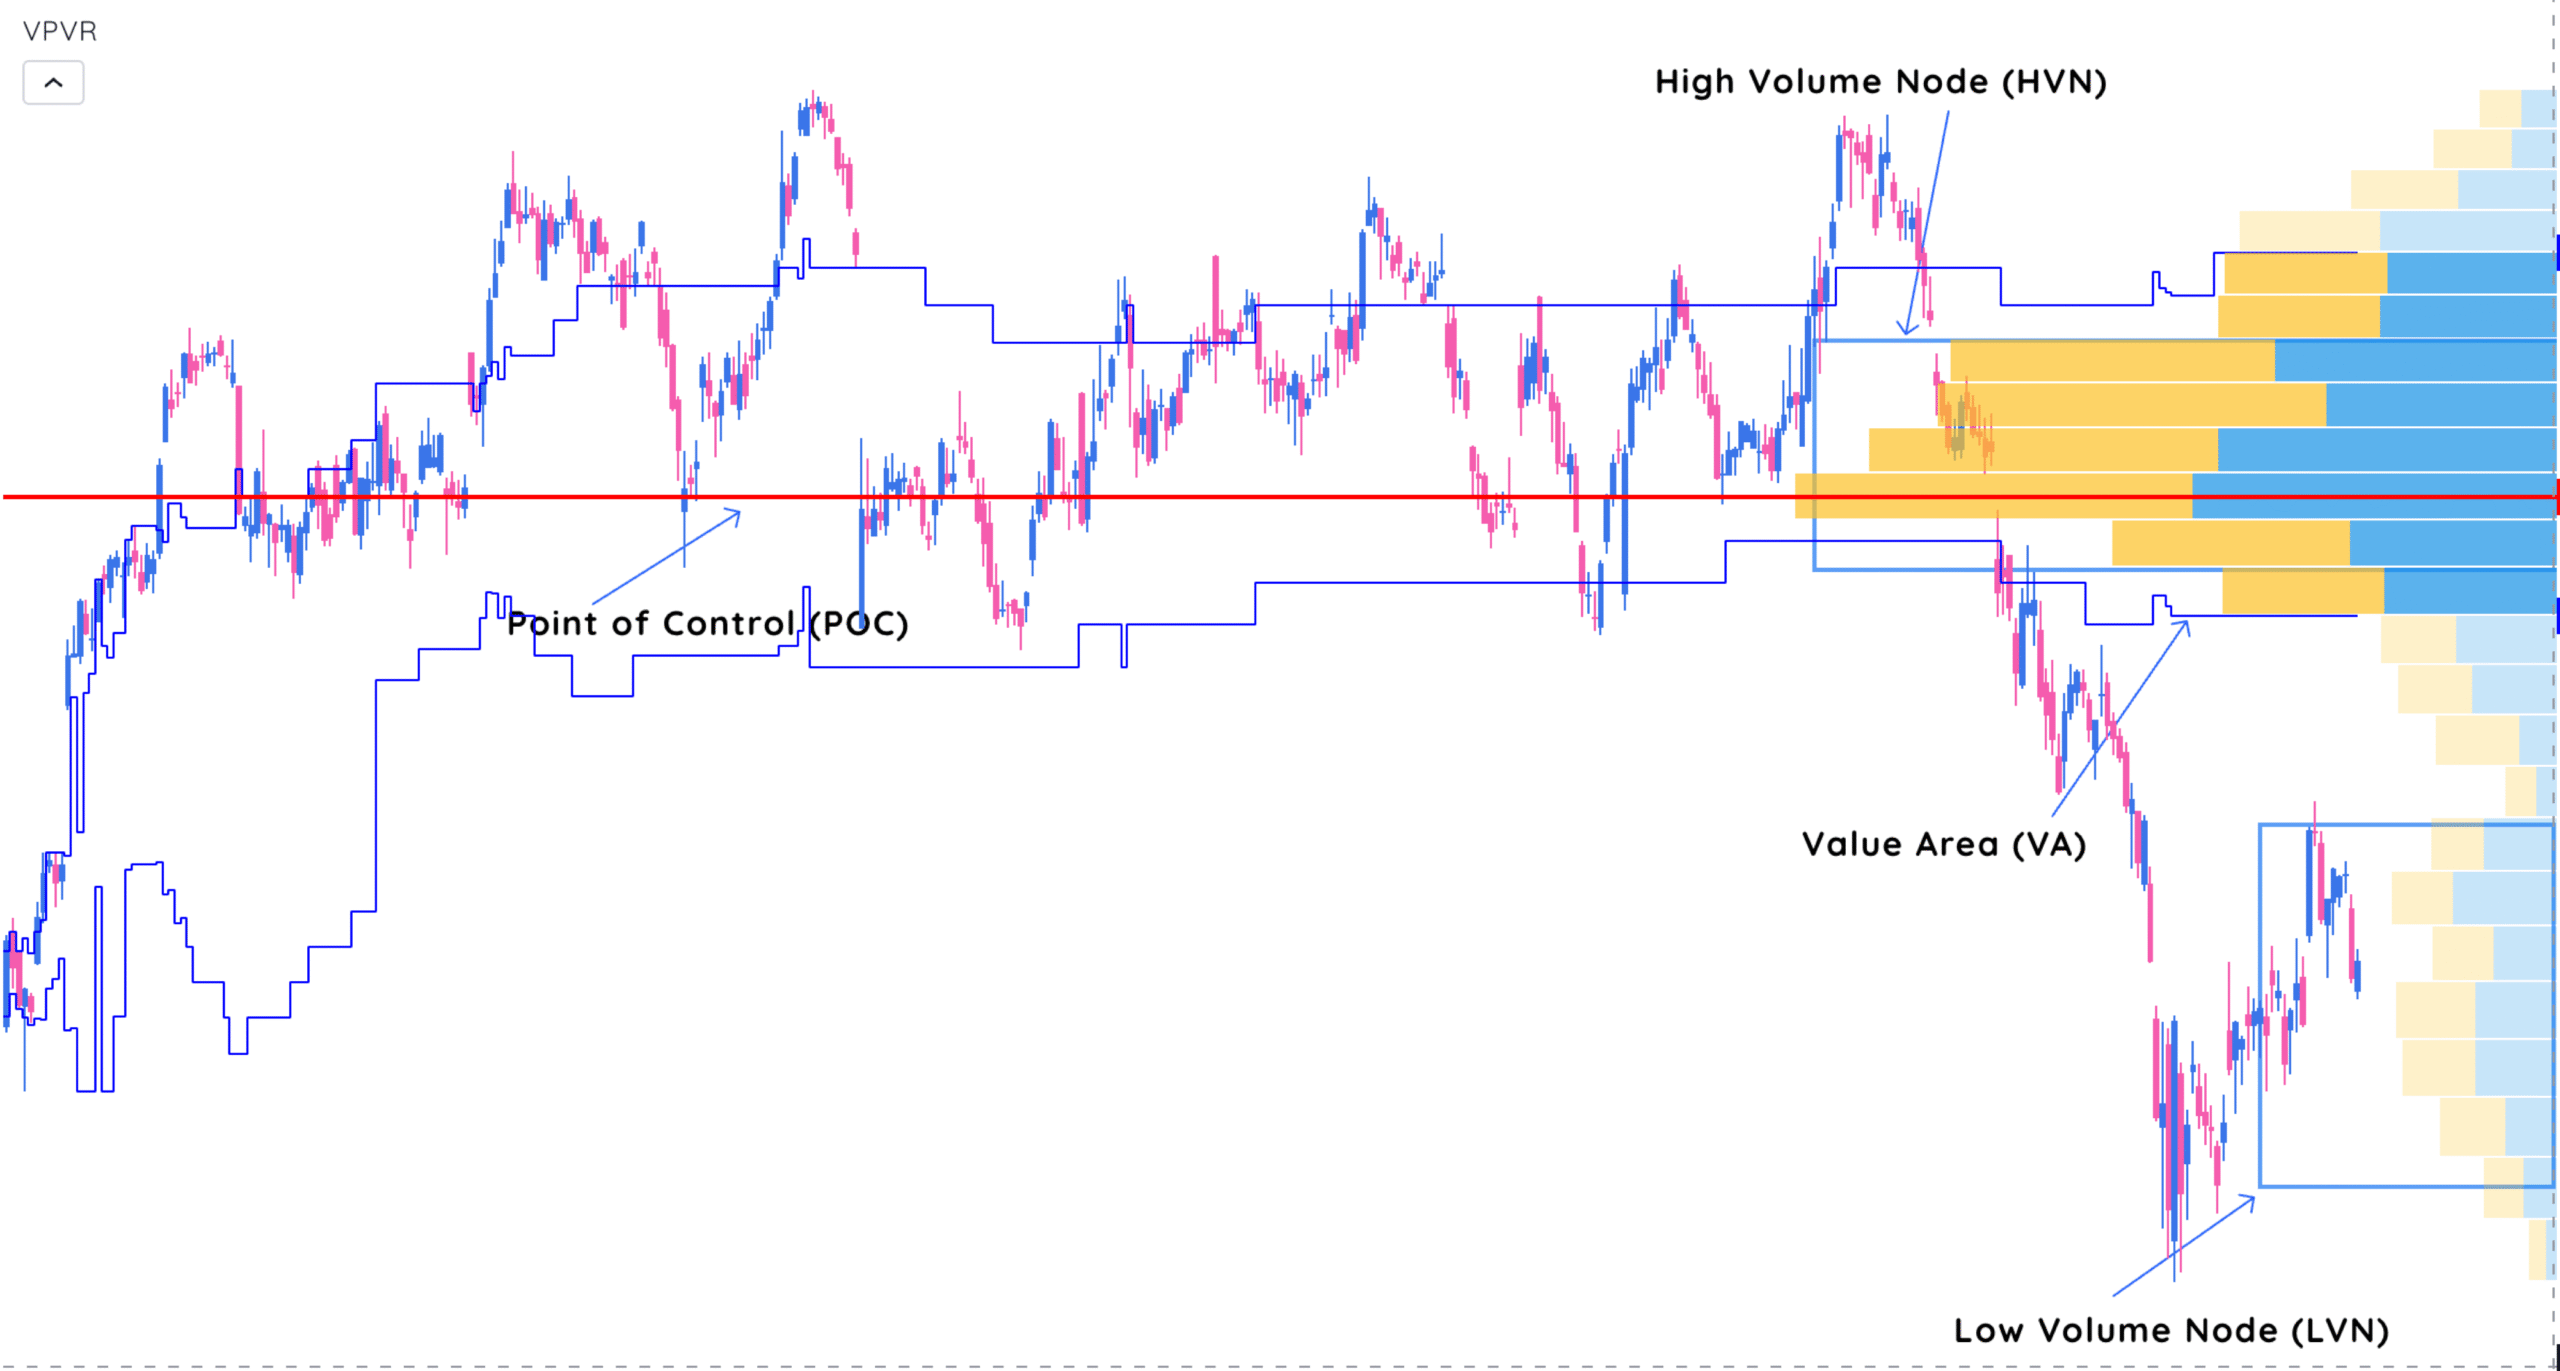
- Point of Control (POC): The price level with the highest traded volume. Think: market memory.
- Value Area (VA): Where 70% of volume traded. It’s the battleground zone—where buyers and sellers found fair value.
- Value Area High (VAH): The top of that zone.
- Value Area Low (VAL): The bottom.
- High Volume Node (HVN): Clusters of heavy volume. Expect price to stick.
- Low Volume Node (LVN): Gaps in volume. Expect price to fly.

Important: Volume Profile is reactive. It doesn’t guess. It shows where interest already happened. You’re reading footprints, not fortune-telling.
How to Read Volume Profile Like a Pro
There are several ways to calculate or anchor a volume profile:
1. Visible Range (VPVR)
Auto-generates based on what’s visible on your screen. Fast but risky—it shifts every time you zoom. Use it for quick checks, not serious decisions.
2. Anchored Volume-by-Price (AVbP)
You choose the starting point—like an earnings gap, major breakout, or news candle. Way more precise.
3. Measured Volume Profile
You define both the start and end. Great for examining defined ranges like consolidation zones or trend legs.
If your platform only offers VPVR, be cautious. Zoom changes context. Misaligned volume shelves = bad trades.
Why Volume Profile Matters
Most indicators trail price. Volume Profile sits beside it. It doesn’t tell you when something happened—it shows where it mattered.
When price moves into a low-volume zone? There’s less resistance. That’s often where the action is.
When price revisits a high-volume node? Expect a pause. Sometimes reversal. Sometimes just noise. But it’s rarely meaningless.
Smart Volume Profile Strategies
1. Trade the Volume Shelf
A volume shelf is a flat area where volume stacked up. Think of it as a price floor or ceiling made of previous conviction.
Setup Example:
- Price pulls back to a wide shelf (high HVN zone)
- Volume is drying up
- Support forms just above the VAL
Enter with a tight stop below the shelf. Risk:reward just tilted in your favor.
If the shelf breaks? It usually drops fast to the next HVN.
2. Use Volume Gaps to Spot Fast Moves
Low volume zones = inefficiency. Price tends to zoom through these areas.
What to watch for:
- Price breaking out of a range and entering an LVN zone
- Little to no resistance overhead
- Clean path to the next HVN
If price is moving through a low-volume zone with increasing momentum, there’s usually a short-term opportunity. Get in. Trail fast.
3. Multi-Timeframe Confluence
Volume Profile on one chart is helpful. On multiple timeframes? Killer.
Stacking Profiles:
- Daily profile: See long-term support and resistance
- Hourly: Track where buyers/sellers have reloaded
- Intraday (5/15-min): Snipe entries or scale exits
If the hourly POC aligns with the daily VAL? That’s not coincidence. That’s confluence.
Explore how to screen for multi-timeframe confluence in Deepvue’s swing trading presets.
Using Volume Profile with Other Tools
Pairing Volume Profile with 1–2 solid indicators gives you real context.
A few smart combos:
- Moving averages: Use 20/50 EMA to confirm trend. Profile shows structure; MAs show momentum.
- VWAP: Anchored VWAP + AVbP = precision zones. Great for day trading.
- Price action: Look for hammer candles or reversal patterns at VAL or HVN.
- Fundamentals: After earnings? Anchor from the earnings candle and see where volume clusters now.
Avoid indicator soup. This isn’t TradingView cosplay. Be surgical.
Pros and Cons Without the Fluff
Pros
- Reveals hidden S/R: Based on volume, not guesswork.
- Highly customizable: Tailor to your timeframe or strategy.
- Data-driven: No guessing games. The market literally voted.
Cons
- Can get subjective: Especially if you use VPVR with loose zooming.
- Less effective in thin markets: Not enough volume = noise.
- Historical only: It’s reactive. Doesn’t predict on its own.
Common Mistakes to Avoid
- Zooming in/out without resetting VPVR.
- Using it without context from price action or broader market.
- Thinking more bars = more clarity. Sometimes simplicity wins.
Final Thoughts
Volume Profile doesn’t tell you what will happen. It tells you where traders cared. That’s more useful than most people realize.
Once you start seeing price in terms of volume structure—not just candles—it changes how you trade. Support and resistance become obvious. Breakouts make sense. Fakeouts stop hurting.
Read where volume piled up. Trade around where it didn’t.
That’s edge.


