

Last Updated:
June 27, 2024


What is the Detrended Price Oscillator?
The Detrended Price Oscillator (DPO) strips out long-term trends from price data so traders can see short-term cycles more clearly. Unlike most oscillators, it’s not trying to track momentum or overbought/oversold conditions in the usual way. It’s backward-looking by design.
The DPO shifts price backward on the chart, measuring how far off the price was from a moving average in the past. This makes it a poor momentum tool—but a solid lens for spotting repeatable short-term rhythms.
Think of it as cycle goggles.
How DPO Works
DPO removes trends longer than your chosen period. So if you’re using a 20-period DPO, anything longer than 20 bars gets tossed out. What’s left? The short-term hum underneath all that trend noise.
DPO Calculation
The formula’s simple:
DPO = Price from (n / 2 + 1 periods ago) – n-period SMA
Example with a 20-period setting:
- Look at the price from 11 bars ago
- Subtract the 20-bar Simple Moving Average
- Plot that result
The offset is what makes it useful. Peaks and troughs in DPO are aligned with price highs and lows—not lagging them.
How to Read DPO Signals
The DPO doesn’t scream “buy” or “sell.” It whispers, “Hey, this cycle looks familiar.” Here’s how to listen.
1. Zero Line Crosses
- Above zero = price was above the average back then
- Below zero = price was below the average
Use these to confirm direction, not to trade blindly.
If DPO crosses above zero while price forms a base, it might confirm early momentum—but only in context.
2. Cycle Peaks and Troughs
The real value is in cycle timing. Count the bars between DPO highs or lows. That’s your average cycle length.
If the last few lows are spaced 30 bars apart, and you’re 28 bars in—set alerts.
3. Overbought/Oversold Clues
There’s no hard level here. But if the DPO spikes to its usual max, you’re near a short-term extreme.
- High reading? Price was well above its average = potential cool-off
- Low reading? Price was way under = possible bounce
It’s not RSI, but it’s not useless either.
4. Divergences
- Bullish divergence: Price makes lower lows, DPO makes higher lows
- Bearish divergence: Price makes higher highs, DPO makes lower highs
It’s not always clean, but when divergences show up on DPO and a second indicator (like RSI), they’re worth a closer look.
5. Sync With Other Tools
DPO works best as part of a setup stack.
- Combine it with MACD to catch trend shifts
- Use RSI or Stochastics to flag oversold/overbought within the cycle
One indicator is a guess. Two or three is a thesis.
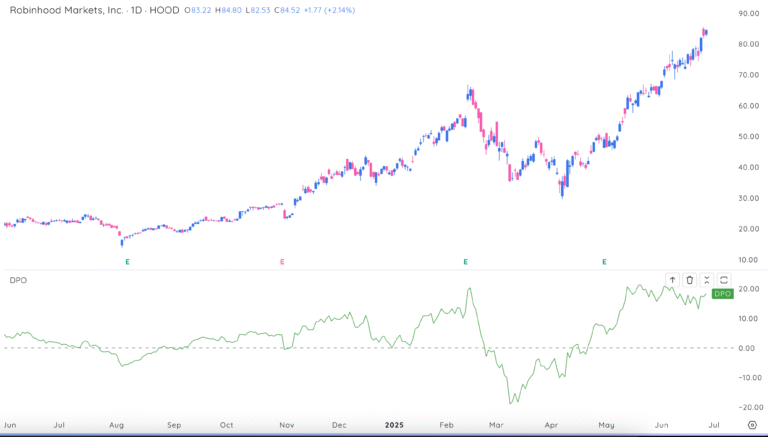
Real Example: Robinhood (HOOD) and Cycle Clarity
Here’s a live chart showing Robinhood Markets (HOOD) with the Detrended Price Oscillator (DPO) applied:
Symbol: HOOD
Company Name: Robinhood Markets Inc

Look at how DPO signaled distinct cycle turns:
- March 2025: DPO printed a deep trough while price was bottoming near $35. That cycle low led into a powerful advance.
- May to June 2025: DPO remained strongly positive while price surged from the $50s into the $80s—keeping traders in sync with the rhythm of the move.
- Peaks align with price stalls: When DPO flattens or pulls back from extremes, price often pauses or consolidates.
This type of analysis helps you time your trades and adapt to changing conditions using short-term price cycles—not guesswork.
DPO won’t predict every reversal, but it sharpens your pattern recognition by exposing market cadence under the surface.
DPO Limitations (Read This Twice)
DPO is useful, but don’t over-trust it. Here’s what it won’t do:
1. It Doesn’t Trade For You
DPO shows where past highs/lows happened. It doesn’t tell you what will happen next. You still need context.
2. It Ignores the Trend
Seriously. If the trend is strong and one-sided, DPO will happily show a “buy” right in the middle of a breakdown.
Use trend tools like moving averages to stay out of trouble.
3. Peak/Low Levels Vary
DPO values aren’t standardized. One cycle might top at 2.5, the next at 1.8. Use the rhythm, not the level.
When Should You Use DPO?
- You trade ranges or sideways chop
- You’re trying to time entries within a bigger trend
- You’re tracking repeating cycle patterns
- You want to fade extremes, but with some structure
Avoid it when:
- You’re in a strong directional trend
- You’re trying to ride momentum
- You want one indicator to make all your decisions
Final Thought
The Detrended Price Oscillator won’t replace your setup. It’ll sharpen it.
Use it like a metronome for the market’s short-term tempo. When price, pattern, and timing all line up, you’ll know it’s time to move—not guess.
Frequently asked questions

Related articles
Explore relevant educational content & features.
-

-

Use Relative Measured Extension To Sell Into Strength
September 16, 2025[kt_reading_time] -
3 Must-Know Mike Webster Indicators That Could Transform Your Trading
August 7, 2025[kt_reading_time] -
