

Last Updated:
June 26, 2024


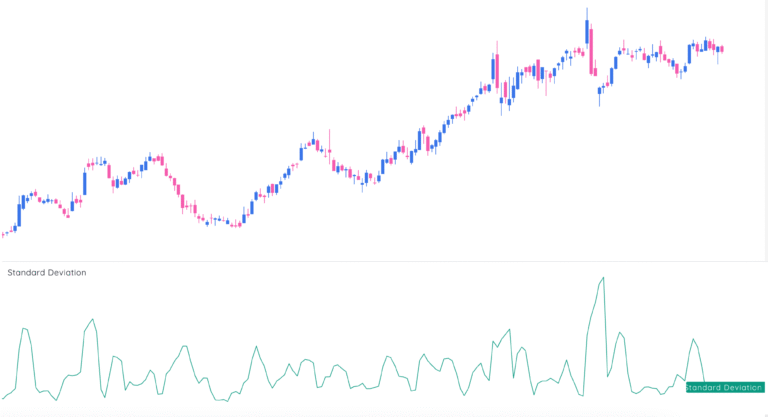
What Standard Deviation Actually Tells You
Standard deviation measures how far price strays from its average. When price hugs its mean, deviation stays low. When it starts swinging, deviation spikes.
Traders use this to read volatility—real volatility, not vibes. It works across timeframes and pairs well with other tools like moving averages or Bollinger Bands. But at its core, standard deviation is about one thing: understanding how chaotic price action is getting.
How It’s Calculated (Without the Buzzwords)
You don’t need to memorize the formula, but knowing the logic behind it helps:
- Take the average close over n periods (your SMA).
- Subtract that average from each closing price in the period.
- Square those differences.
- Average the squares.
- Take the square root.
That’s it. The result: a clean number that tells you how far prices are drifting from the average.
Formula:
SD = sqrt[(Σ(Close – SMA)²) / n]
The higher the number, the messier the market. The lower, the more it’s just pacing in circles.
Reading the Chart Like a Trader
Low Deviation = Bored Market
When standard deviation contracts, price is treading water. Think tight ranges, compressed volatility, low emotion.
You’re watching:
- Consolidation before a breakout
- Market tops with long-term strength
- Bottoms where no one cares anymore
High Deviation = Emotional Market
Spikes in standard deviation usually follow price chaos. This can be strength or panic—context matters.
You’re watching:
- Breakouts with conviction
- Panic-driven selloffs
- Market tops where traders can’t decide if it’s over or not
Pro tip: The move before the spike in deviation usually matters more than the spike itself.

Trading With Standard Deviation
1. Identify Volatility Conditions
Use standard deviation to gauge if you’re in a trend, chop, or setup for a breakout.
Examples:
- Rising deviation + trend = follow-through likely
- Dropping deviation + range = breakout setup
- High deviation + no direction = trap zone
For help recognizing these setups, read our guide on technical pattern strategies.
2. Spot Potential Tops and Bottoms
- Topping with increasing volatility? Indecision—tighten stops.
- Topping with falling volatility? Strong trend—stay with it.
- Bottoming with low volatility? Nobody cares—yet.
- Bottoming with rising volatility? Panic selling—watch for reversal.
This aligns with how traders read the market bottom.
3. Combine With Bollinger Bands
Bollinger Bands are built using standard deviation, so you’re already using it if you chart those. But zooming in on the actual deviation value helps you spot when volatility expansion is starting—before price pushes past the bands.
Standard Deviation in the Real World
Apple (AAPL) Example
Let’s say you tracked Apple’s annual returns over five years:
- 2019: 88.97%
- 2020: 82.31%
- 2021: 34.65%
- 2022: -26.41%
- 2023: 28.32%
The average return: 41.57%
Standard deviation: 46.90%
That tells you Apple’s returns swing wildly year to year. A big return isn’t surprising. Neither is a crash. That context changes how you manage risk.
Why Standard Deviation Works (and When It Doesn’t)
Strengths:
- Easy way to measure market movement intensity
- Treats all price points equally—no cherry-picking
- Pairs well with trend and momentum strategies
- Useful across asset classes: equities, futures, crypto, etc.
Weaknesses:
- Outliers can skew the reading
- Doesn’t tell you direction—only intensity
- Slightly clunky to calculate manually (but Excel eats it for breakfast)
And here’s the real catch:
Standard deviation sees all deviation as risk.
So if your trade rips +10% above average, SD will treat that like a problem. It doesn’t know good vs. bad—just different. That’s fine. You do the interpretation.
Key Properties Traders Should Know
- Additivity: You can combine datasets. Handy if you’re analyzing portfolio-level volatility.
- Scale Invariance: Works whether you’re looking at pips, points, or percent.
- Always Positive: No guessing if it’s “above or below” zero—just how wide.
Variance vs. Standard Deviation (Traders Only Care About One)
Variance is the squared deviation from the mean. Standard deviation is just its square root. Variance makes your data unusably bulky. Standard deviation brings it back into the unit you care about: price.
That’s why traders use SD, not variance. It’s cleaner. It’s on the same scale as the asset. And you can read it off a chart without needing to squint.
Final Word: Read the Room, Not Just the Number
Standard deviation doesn’t make trading decisions for you. It just tells you how loud the market is getting.
- When it’s whispering: prep for movement.
- When it’s screaming: stay sharp. Chaos is opportunity—but also danger.
Treat SD like a volatility compass. It doesn’t give you the map. But it tells you whether the ground’s shaking.
Frequently asked questions

Related articles
Explore relevant educational content & features.
-

-

Use Relative Measured Extension To Sell Into Strength
September 16, 2025[kt_reading_time] -
3 Must-Know Mike Webster Indicators That Could Transform Your Trading
August 7, 2025[kt_reading_time] -
