

Last Updated:
June 7, 2024


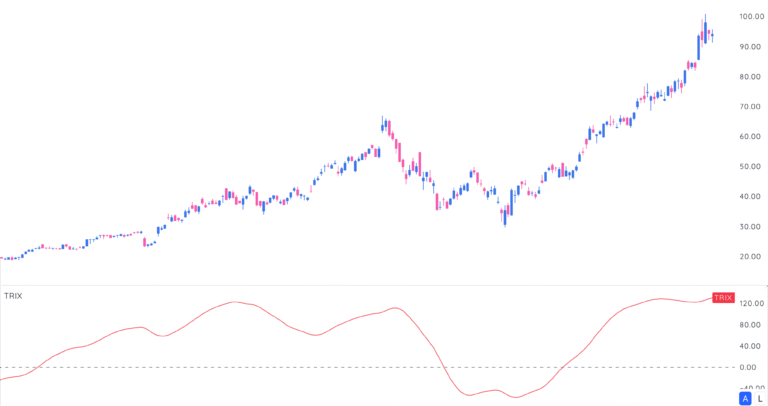
What Is TRIX, Really?
The triple exponential average (TRIX) is a momentum indicator that shows the percentage change of a moving average smoothed three times.
Translation: It’s an oscillator that wipes out the market noise most indicators can’t ignore.
TRIX isn’t new. Jack Hutson, the editor of Technical Analysis of Stocks & Commodities magazine, introduced it back in the early ’80s. It’s still in charts today because it does two jobs well:
- Filters insignificant price moves
- Spots momentum shifts
Yes, it behaves like the MACD indicator—but it’s smoother. Way smoother.
How TRIX Works
TRIX lives around the zero line, bouncing above and below it.
- Above zero? Momentum’s picking up.
- Below zero? Momentum’s fading.
Some traders also watch for overbought or oversold extremes. Others just use the zero cross:
- TRIX crosses above zero? Buy.
- TRIX crosses below zero? Sell.
And here’s the kicker—when price diverges from TRIX, it often signals a turning point. Ignore it at your own risk.
Quick Example
Imagine TRIX keeps falling while price moves sideways. That’s momentum draining from the market. Smart traders start paying attention.
: The Oscillator Traders Actually Use")
TRIX Calculation (Without the Hand-Holding)
TRIX stacks three exponential moving averages (EMAs) on top of each other. Here’s how:
- Calculate the first EMA from price.
- Take an EMA of that EMA (yes, really).
- Do it again—third EMA.
- Find the percentage change between the current and previous bar of that triple EMA.
Formula:
TRIX(i) = [EMA3(i) - EMA3(i-1)] / EMA3(i-1)
That’s it. No fluff.
Why Three EMAs?
The triple smoothing crushes short-term noise. The result? A cleaner signal that skips over useless wiggles.
Why Traders Still Use TRIX
TRIX isn’t for every market, but where it fits, it shines. Here’s why traders keep it in their toolbox:
1. Noise? What Noise?
TRIX filters out the tiny fluctuations that derail most indicators. It’s built to ignore short-term clutter and lock in on meaningful moves.
2. Leading, Not Lagging (Most of the Time)
TRIX can move ahead of price action. It reacts to momentum shifts before they hit the price chart.
That said, no indicator has perfect foresight. TRIX is best paired with another timing tool to cut down on false signals.
3. Versatile—Oscillator and Momentum Gauge
Whether you’re spotting overbought levels or gauging trend direction, TRIX plays both roles. Zero-line crossovers are the simplest signal, but divergence setups are where TRIX really earns its keep.
Using TRIX Effectively
If you’re going to use TRIX, don’t just slap it on your chart and hope. Here’s how to make it work:
Stick to Strong Trends
TRIX thrives in trending markets. In sideways markets, it tends to throw off false signals.
Pair with Another Indicator
TRIX works best alongside a second tool like the Relative Strength Index (RSI) or volume-based indicators. It confirms the momentum shifts, reducing the odds of chasing shadows.
Adjust the Period
The default setting won’t suit every asset. Fine-tune the period length to match the market’s rhythm.
Watch Divergences Like a Hawk
This is TRIX’s hidden strength. When price makes new highs and TRIX doesn’t follow, momentum is fizzling out. That’s often a cue to tighten stops or prep for a reversal.
Final Thoughts
TRIX isn’t flashy, but it’s built for traders who value clean signals over clutter. It’s a sharp momentum tool that filters noise, flags early shifts, and keeps your charts from looking like spaghetti.
Is it perfect? No.
But in the right market, with the right settings, TRIX gets you in ahead of the herd—quietly.
Frequently asked questions

Related articles
Explore relevant educational content & features.
-

-

Use Relative Measured Extension To Sell Into Strength
September 16, 2025[kt_reading_time] -

3 Must-Know Mike Webster Indicators That Could Transform Your Trading
August 7, 2025[kt_reading_time] -
