Last Updated:
September 16, 2025
Why Selling Into Strength is Key to Trading Success
Top traders often emphasize the importance of selling into strength to lock in profits and manage risk effectively. When a stock is extended significantly above its moving averages, it may signal overbought conditions, indicating a potential pullback or reversal.
Selling into strength allows traders to:
- Maximize profits: Capture gains before a stock retraces.
- Control risk: Exit positions at optimal levels to avoid losses during pullbacks.
- Capitalize on momentum: Take advantage of strong price moves while avoiding overextended positions.
The Relative Measured Extension (RME) indicator helps traders identify these critical selling points by measuring how far a stock has extended from its moving average compared to its historical behavior. This provides a clear, objective way to spot oversold or overbought conditions, making it easier to time entries or exits with precision.
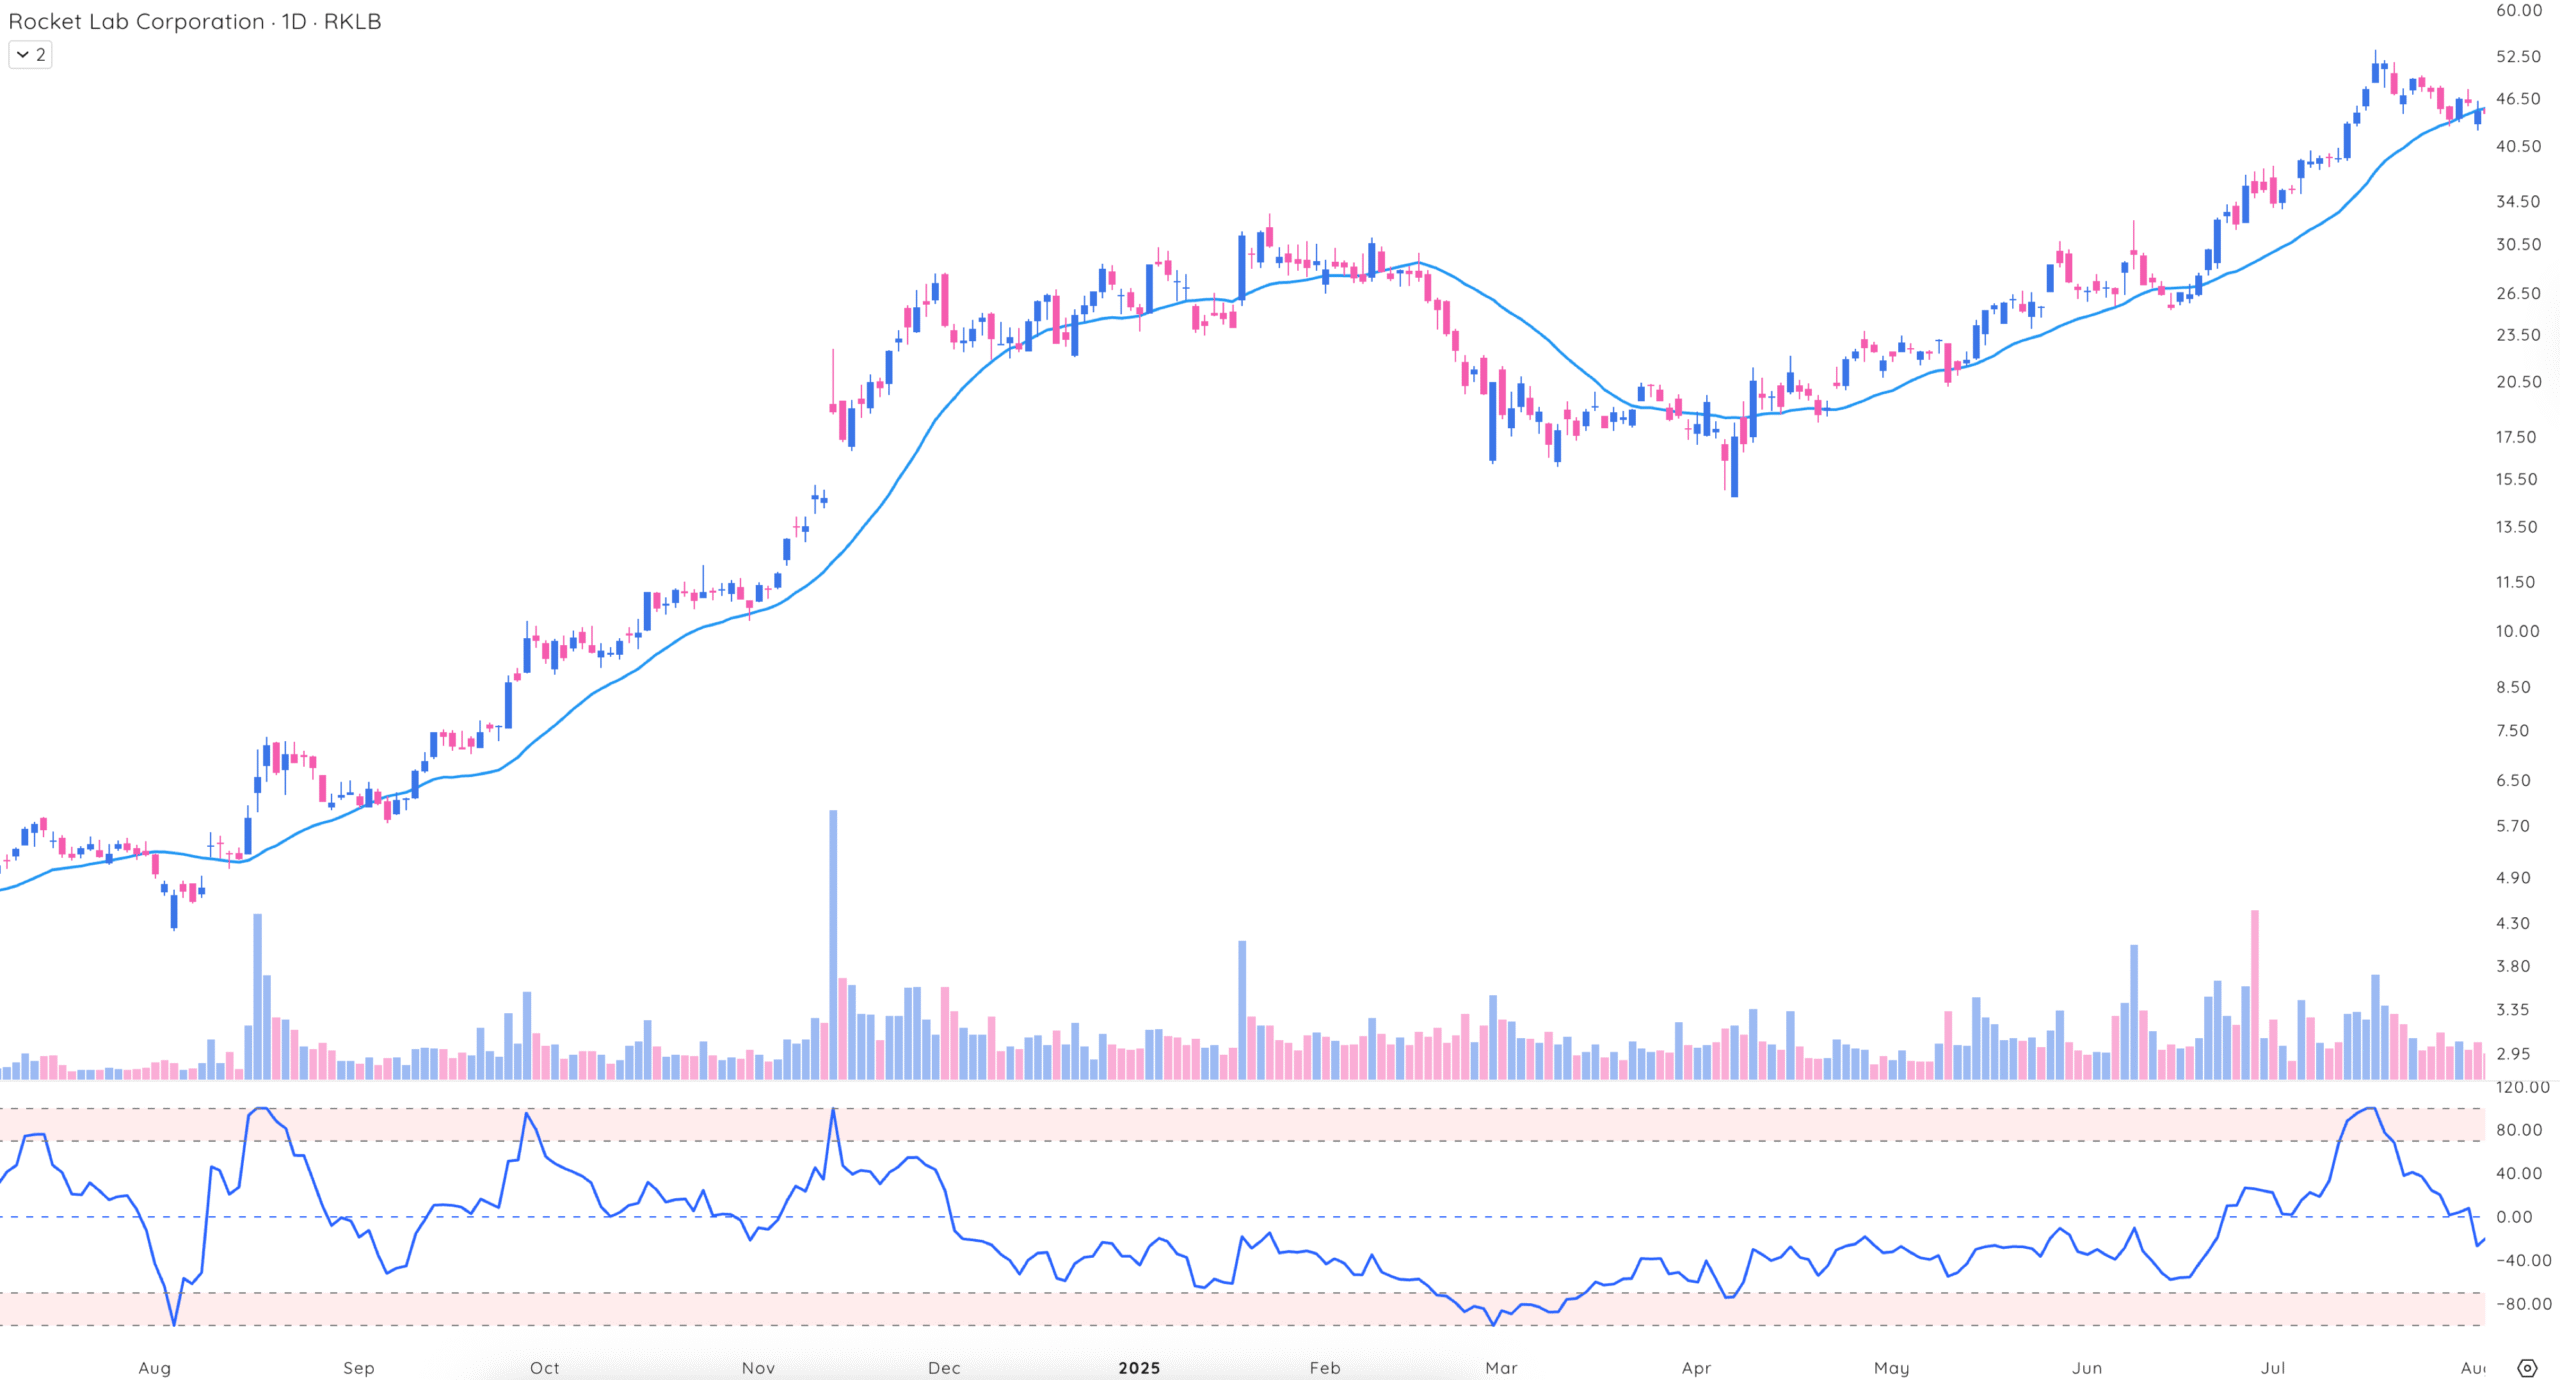
RKLB, a fast-moving stock, showed RME catching key turning points with a 100-bar lookback and 20-day SMA, highlighting overbought conditions for timely exits. It then showed levels of being oversold near the bottom of a new base, signaling a reversal, off of the lows.
What is the Relative Measured Extension Indicator?
The Relative Measured Extension indicator is designed to measure how far a stock’s price has deviated from a specified moving average relative to its historical extensions. Plotted on a scale from -100 to +100, RME helps traders identify overbought (above 70) and oversold (below -70) conditions, signaling potential reversals or pullbacks.
RME is particularly useful for:
- Market analysis: Assessing whether a stock or index (e.g., QQQ) is overextended or nearing a potential bottom.
- Position management: Identifying when a stock may need to pull back or consolidate.
- Reversal detection: Spotting extreme price extensions that often precede reversals.
How the Relative Measured Extension Works
Relative Measured Extension compares a stock’s current extension from a moving average to its historical extensions over a specified lookback period. The indicator oscillates between -100 and +100, with key levels indicating extreme conditions:
- +100: The stock is as far above the moving average as it has ever been in the lookback period.
- -100: The stock is as far below the moving average as it has ever been in the lookback period.
- Overbought zone (70 to 100): Signals potential selling opportunities due to extreme upward extensions.
- Oversold zone (-70 to -100): Indicates potential buying opportunities or the end of a pullback.
RME calculates these values by analyzing past extensions from the moving average and comparing them to the current extension. The indicator also includes customizable red zones (default at ±70) to visually highlight extreme conditions.
When RME approaches +70 or higher, it suggests the stock is overextended and may be due for a pullback. Conversely, an RME value near -70 or lower indicates the stock is oversold, potentially signaling a reversal or bounce.
How the Lookback Period Impacts RME
The lookback period determines how many bars (days, weeks, or minutes) are used to calculate historical extensions.
Comparison to Historical Data:
A longer lookback period, like 250 bars, compares the current extension to a broader historical range, making it ideal for position traders looking for significant trend changes. A shorter lookback period, such as 50 bars, is more responsive and suitable for swing traders seeking faster signals.
Trading Style Customization:
Position traders can use a 250-bar lookback with a 50-day simple moving average (SMA) to spot significant trend changes. Swing traders can opt for a 100-bar lookback with a 20-day SMA or a faster shift in momentum.
How RME Reveals Selling Points
Relative Measured Extension identifies selling points by highlighting when a stock is significantly extended above its moving average, often signaling overbought conditions. These extreme extensions frequently precede pullbacks or reversals, making RME a powerful tool for timing exits.
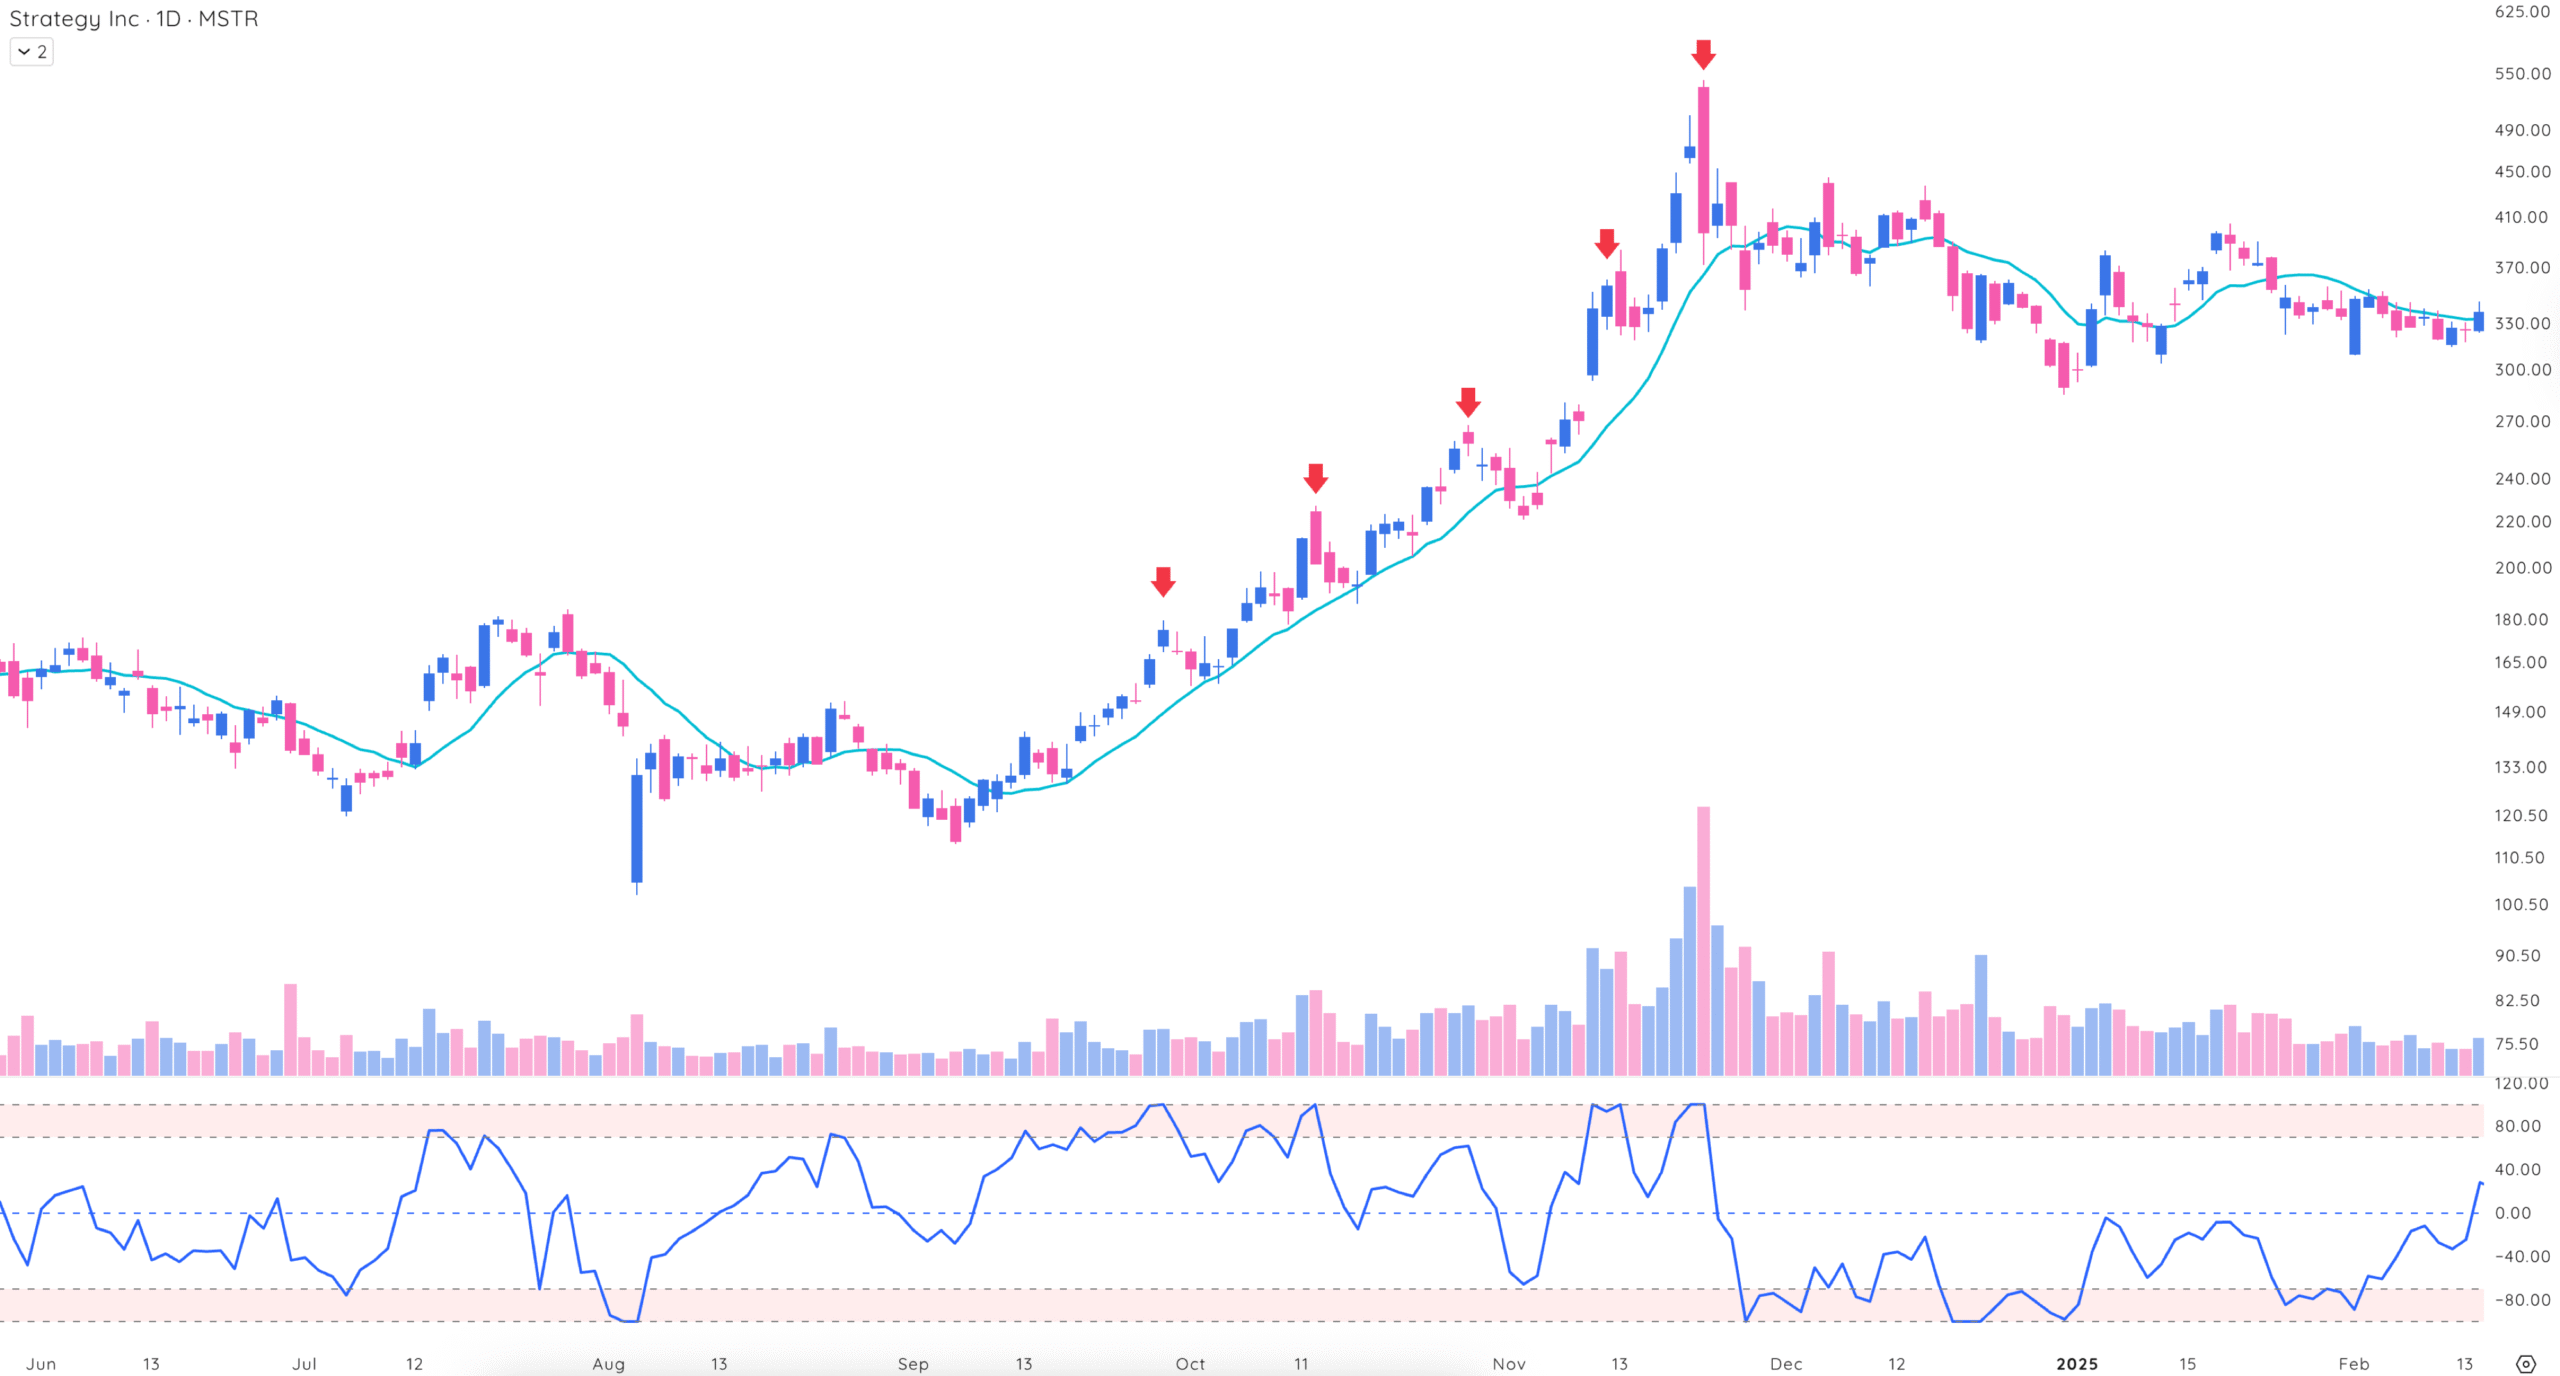
MSTR’s rapid price moves in 2024 were captured by RME with a 50-bar lookback and 10-day SMA. The indicator flagged overbought zones near +70, providing clear signals to sell into strength before pullbacks.
When RME enters the overbought zone (70 to 100), traders should:
- Compare to past extremes: Look back at the chart to see how the stock behaved at similar RME levels.
- Assess trend context: Early in a trend, high RME may indicate strength, while later in a trend, it may signal exhaustion.
- Watch for reversal bars: Combine RME with candlestick patterns, or key reversal bars, for confirmation.
How Selling Into Strength Helps Maximize Profits
For strong stocks in powerful uptrends, Relative Measured Extension may stay near the overbought zone for extended periods. Pullbacks to the 0 level (near the moving average) can signal potential reversals back up, but sustained readings above 70 often indicate the trend is nearing exhaustion.
Selling into strength allows traders to:
- Lock in gains: Exit at peak prices before a pullback erodes profits.
- Reduce risk: Avoid holding through overextended moves that may reverse.
- Reallocate capital: Free up funds to enter new positions with better setups.
RME enhances this strategy by providing objective signals when a stock is overbought, helping traders avoid emotional decisions and exit at optimal points.
Using Relative Measured Extension to Identify Selling Points
The Relative Measured Extension (RME) indicator is a powerful tool for pinpointing optimal selling opportunities by highlighting when a stock is overextended relative to its moving average. By identifying extreme extensions, RME helps traders exit positions at peak prices, maximizing profits and minimizing risk.
Below are key ways to use RME for identifying selling points across various market conditions.
Relative Measured Extension Identifies Ideal Exits on Simple Extension Levels Formations
RME excels at identifying ideal exit points during periods of significant price extension, particularly when a stock reaches simple extension levels above its moving average. These extensions often occur after strong price runs, where the stock moves sharply away from its moving average, signaling potential overbought conditions.
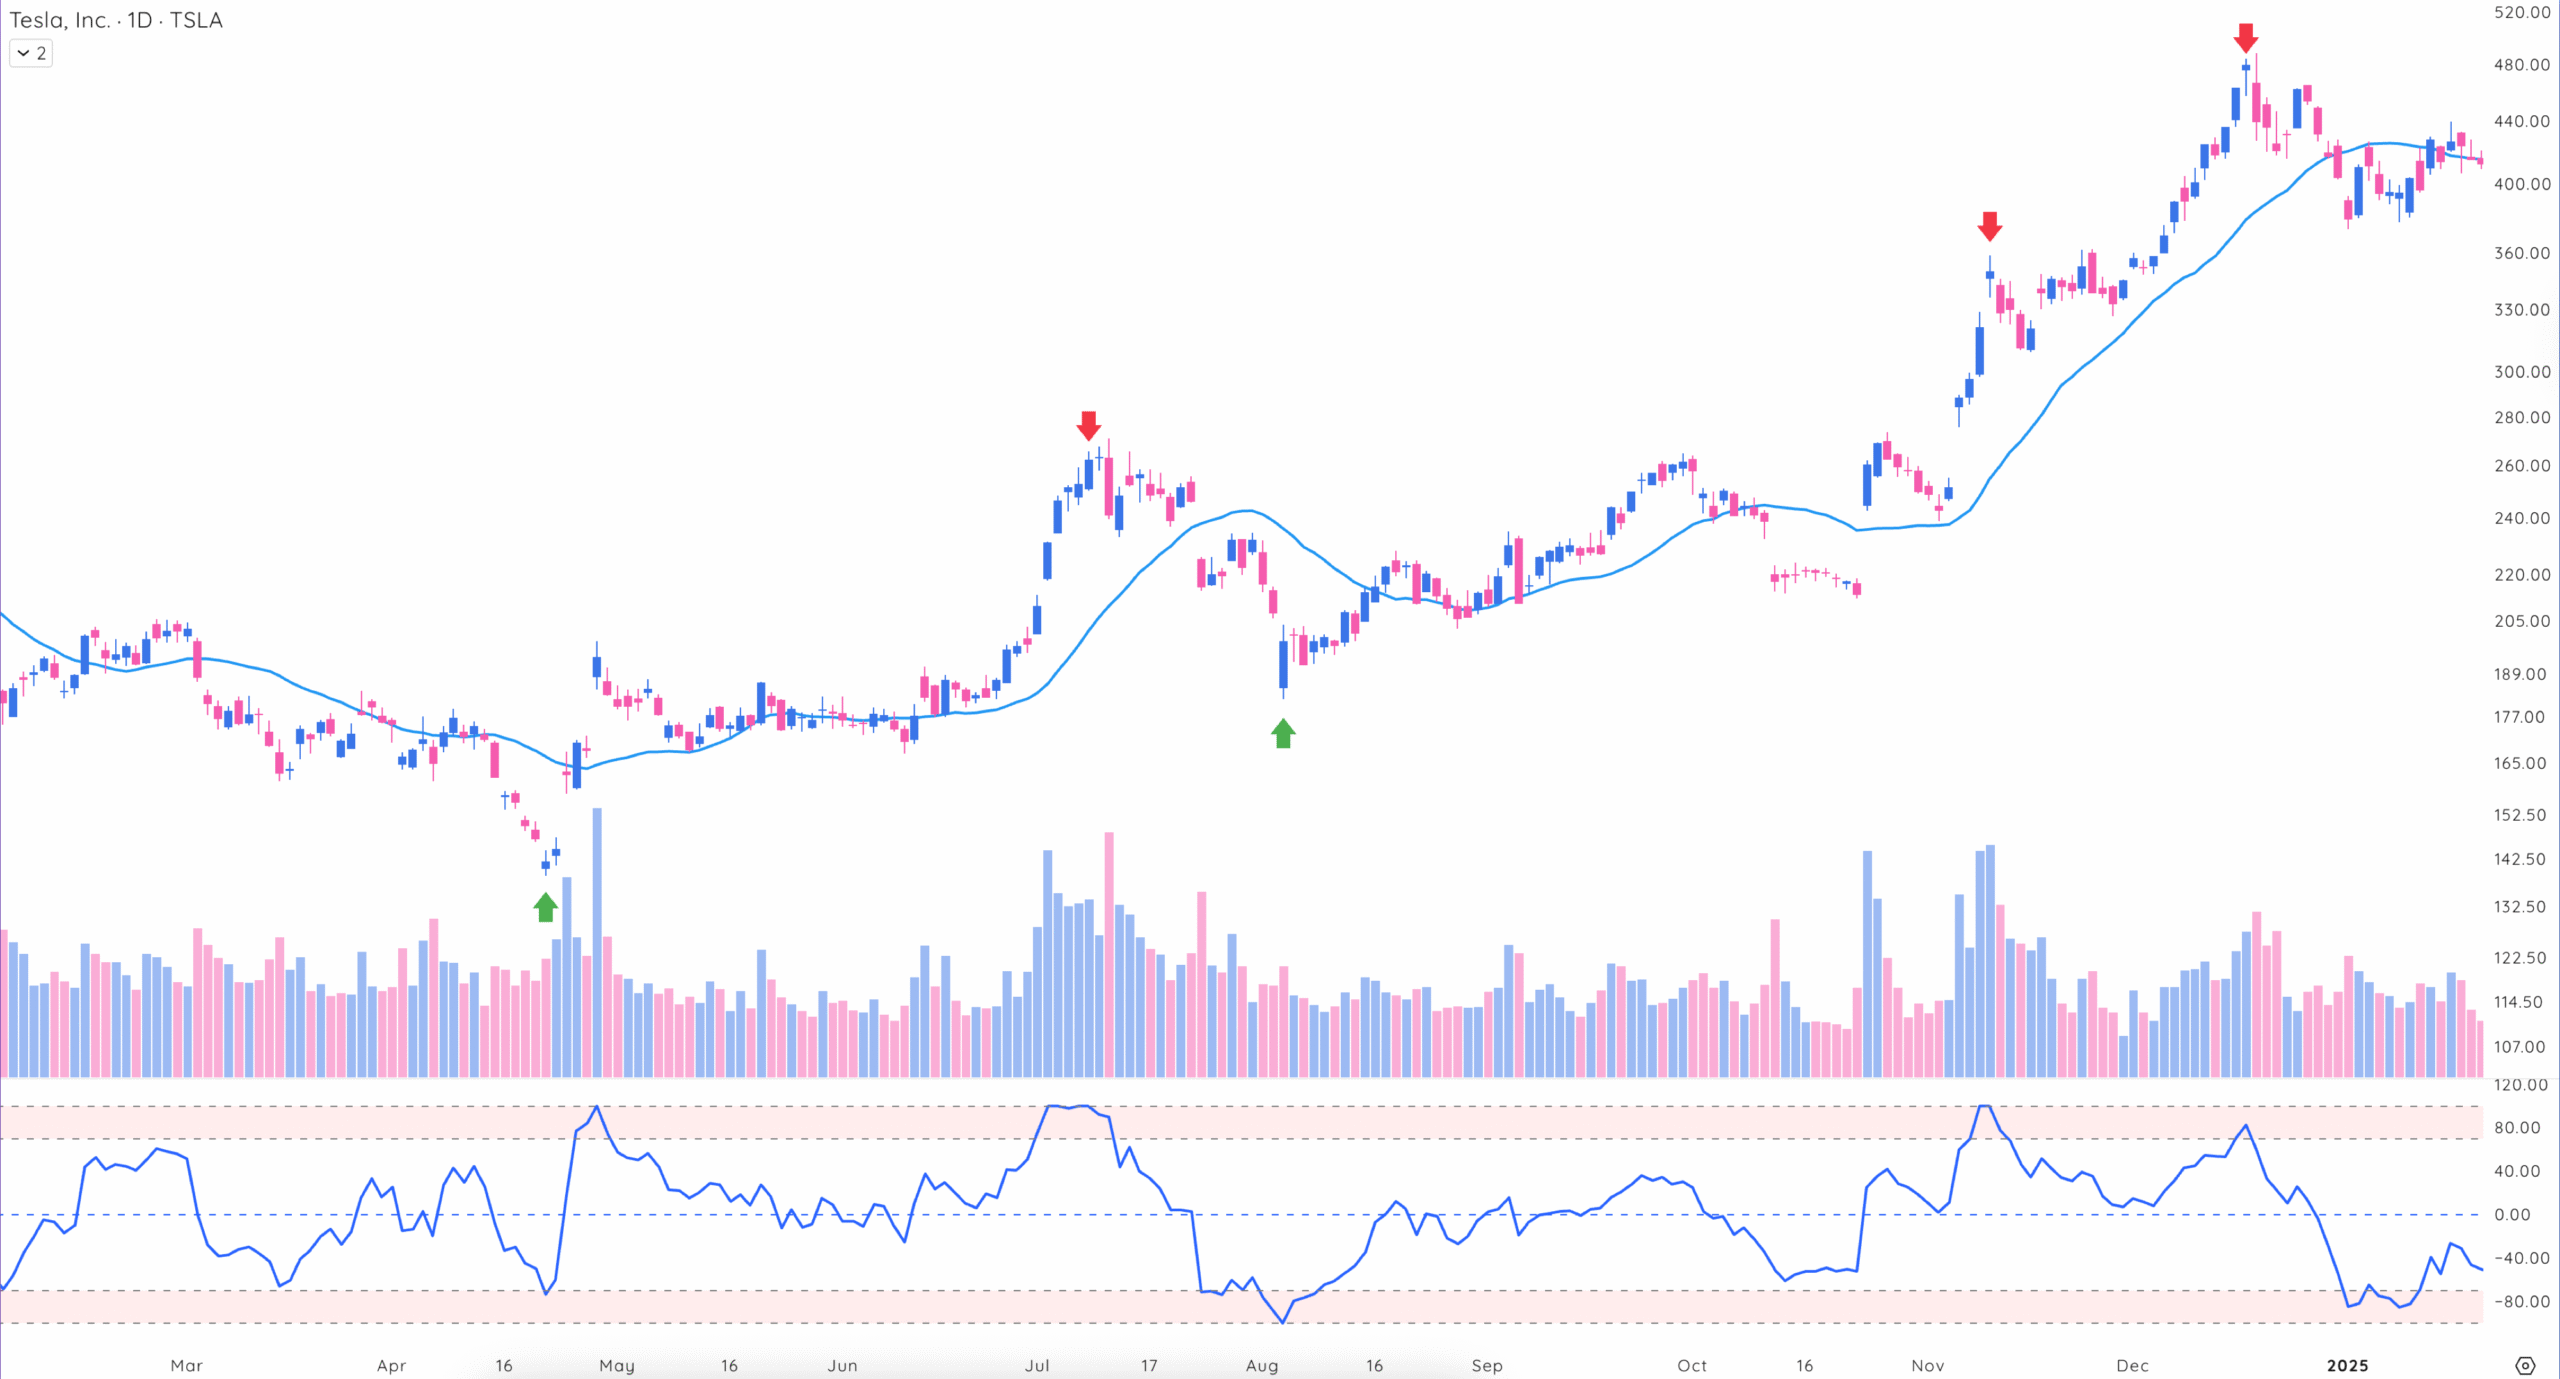
Deepvue RME (100-bar lookback, 20-day SMA)
In 2024, TSLA experienced a sharp rally, pushing its RME value above +70, indicating a significant extension above its 20-day SMA. The RME indicator highlighted these simple extension levels as ideal exit points, allowing traders to sell into strength before a pullback.
Relative Measured Extension Identifies Key Reversal Bars
RME is particularly effective at identifying reversal bars when the indicator enters the overbought zone (70 to 100). These bars often coincide with candlestick patterns like shooting stars or bearish engulfing candles, signaling a potential top.
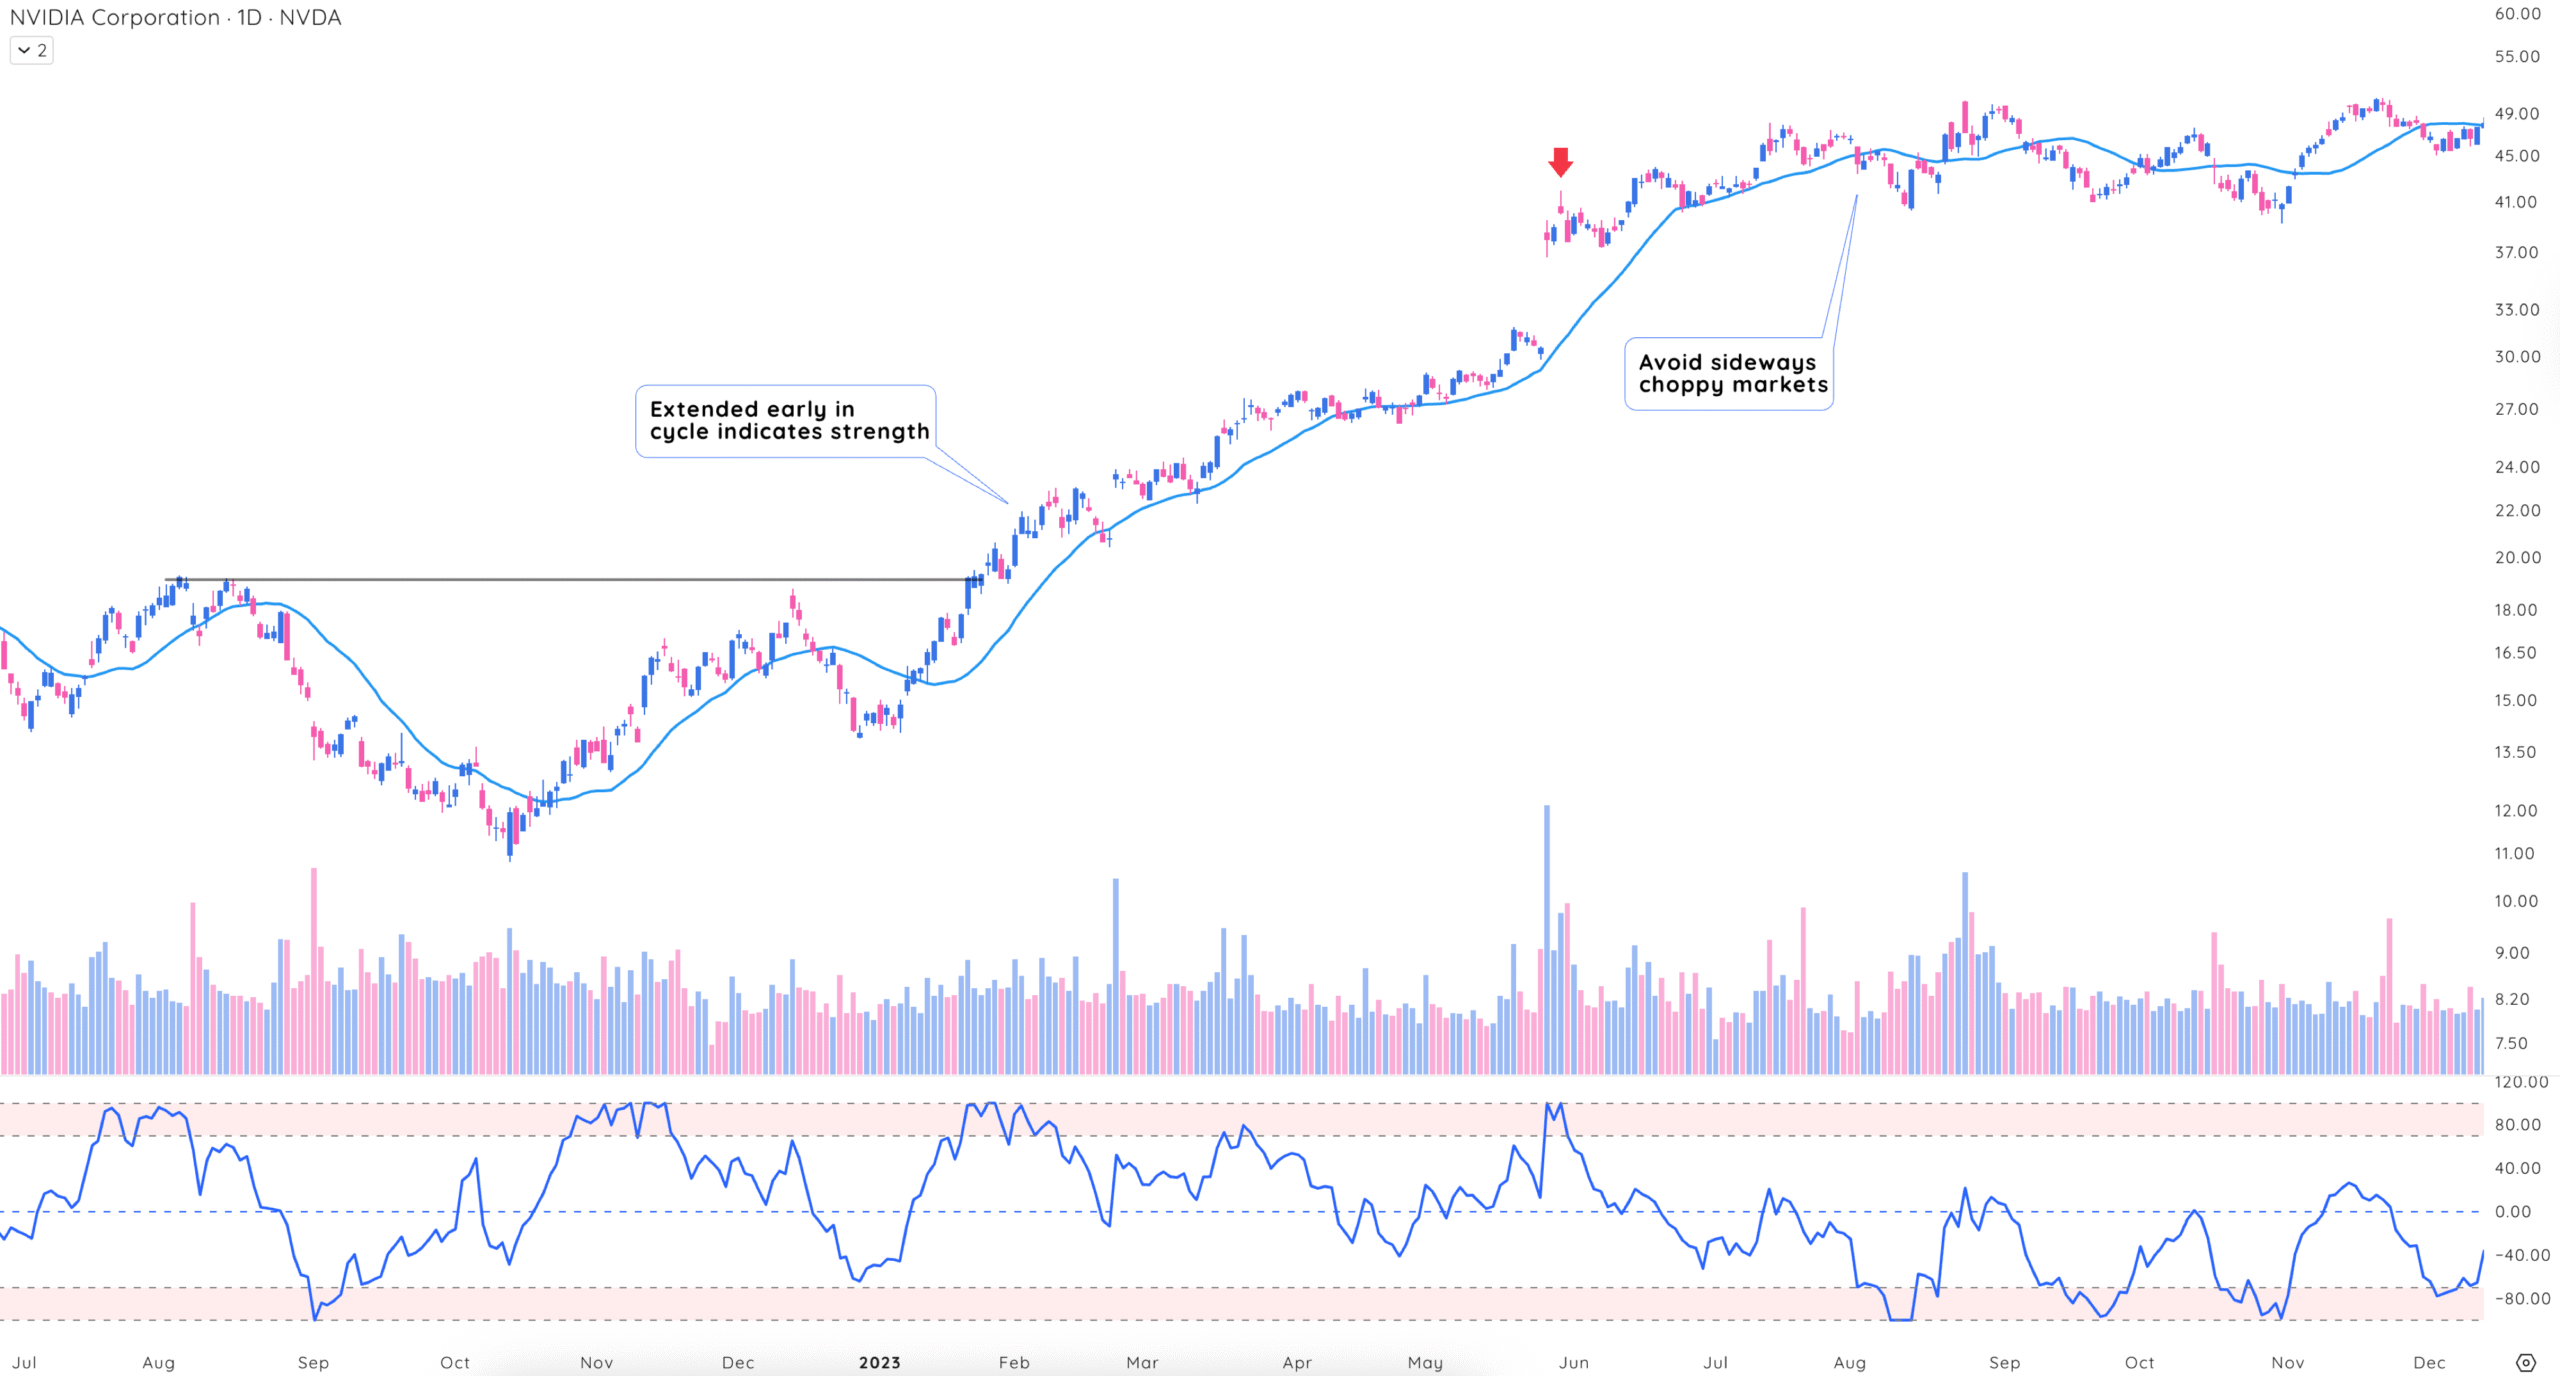
In 2023, NVDA’s RME reached +80 during a strong uptrend, followed by a bearish reversal bar. Traders who sold into this strength avoided a subsequent pullback.
Use Relative Measured Extension to Exit Your Position
By focusing on RME values in the overbought zone (70 to 100), traders can identify these formations and exit positions at optimal levels, especially when confirmed by high volume or bearish candlestick patterns.
To use RME for simple extension levels:
- Act on clear signals: Exit when RME indicates an extreme extension, particularly late in the market cycle, to lock in profits before a potential reversal.
- Monitor RME spikes: Look for RME values approaching or exceeding +70, signaling a significant extension.
- Confirm with price action: Check for signs of weakening momentum, such as stalling price movement or reversal candlesticks.
Adjust for trend strength – Earlier in strong trends, consider partial exits at RME +70 to capture more upside while managing risk. Monitor overbought zones and sell when RME exceeds +70 later in the market cycle.
How to Add RME to Your Charts
Adding the Relative Measured Extension indicator is easy. Simply type “DV” in the indicator search to find all proprietary indicators.

Change the RME settings to adjust LookBack Period and Moving Average Length:
- Look Back Period: The Relative Measured Extension indicator allows users to specify how far back to measure past extension levels in price action.
- Moving Average Length: Select the moving average to see the levels of extension against.
Your style of trading will dictate which lookback period and moving average to use.
- Position traders: Stick with the default 250-period look-back and 50-day moving average.
- Swing traders: Use a shorter look-back period and a moving average, like a 50-period look-back and a 20-day moving average.
Experiment with different settings to meet the needs of your individual trading style.
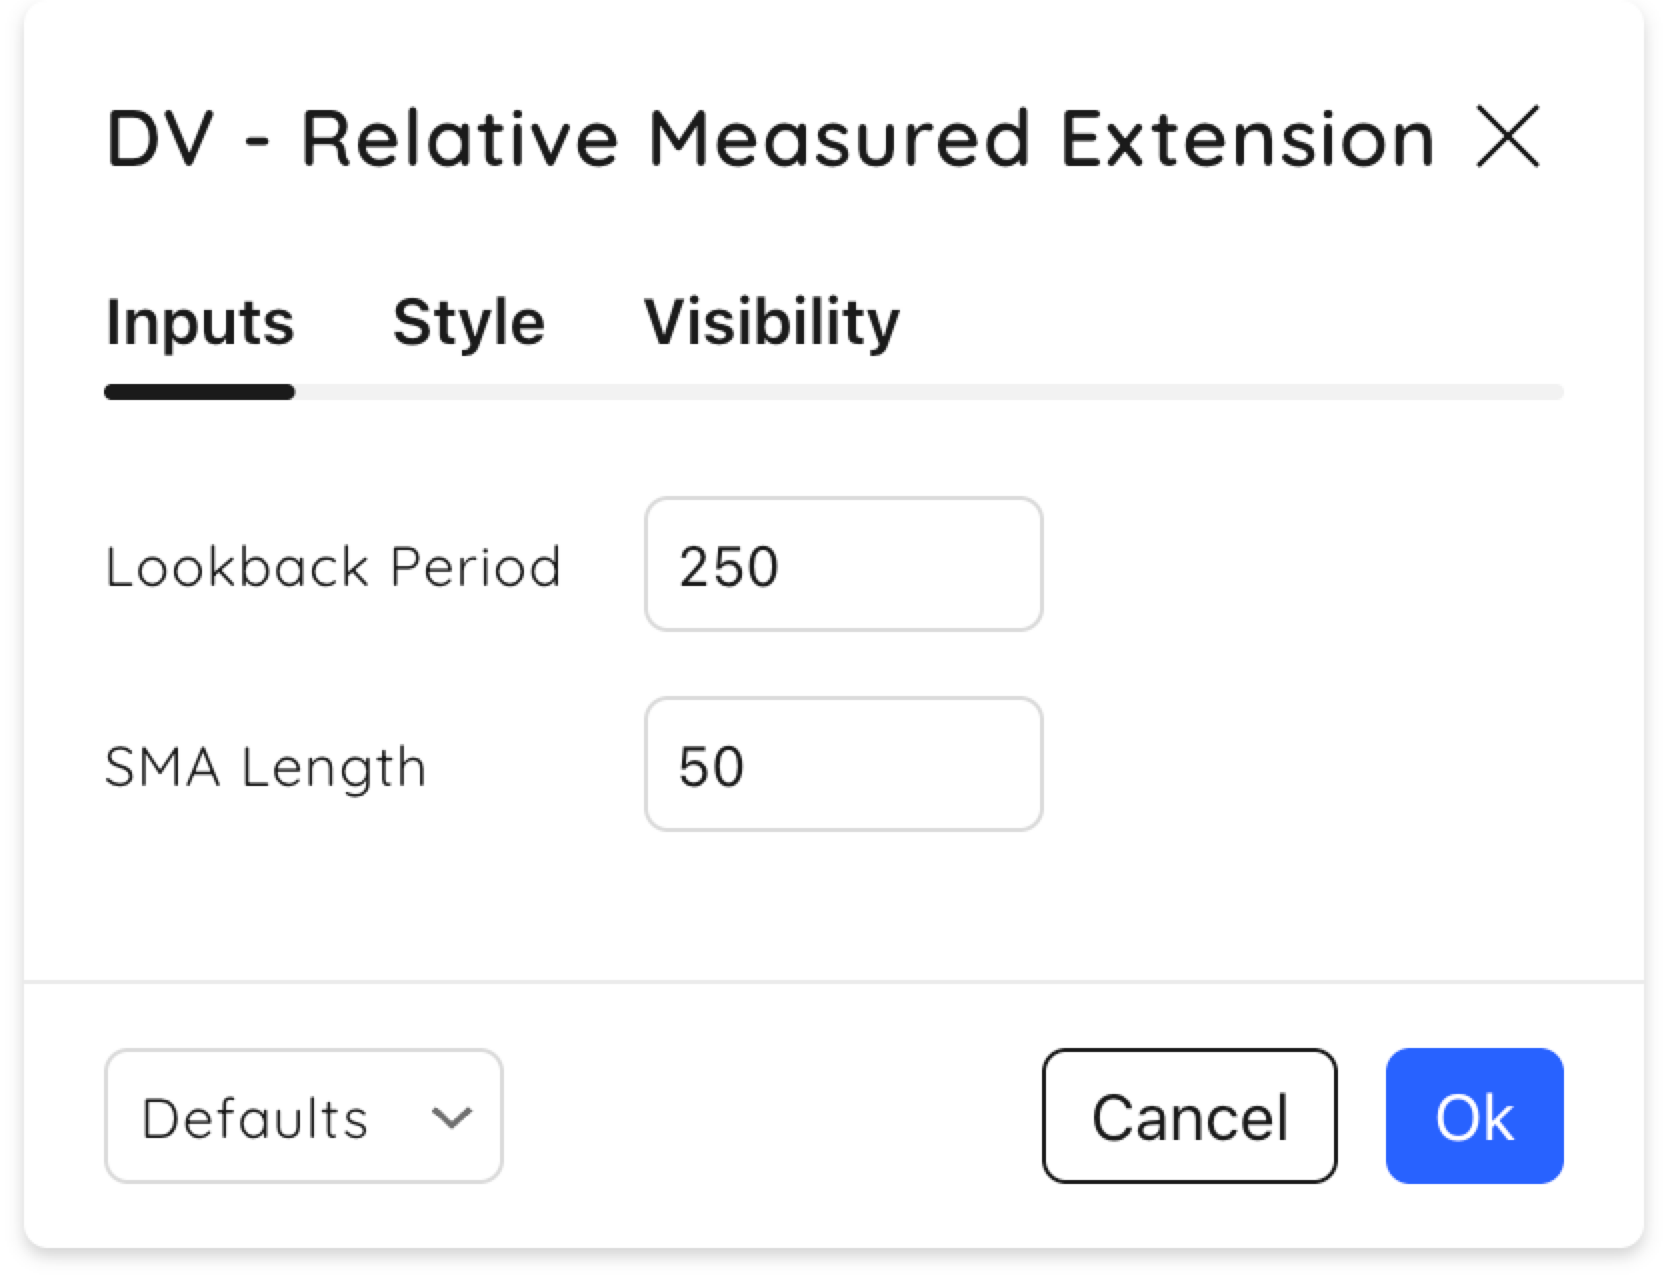
The measurement of extension is relative to the lookback period compared to the moving average selected.
Final Thoughts: Maximize Returns By Selling Stocks Into Strength
Selling into strength is a proven strategy for maximizing profits and controlling risk. The Relative Measured Extension (RME) indicator provides an objective way to identify overbought conditions, helping traders time exits with precision. By combining RME with price action and trend analysis, you can:
- Lock in profits: Sell at peak extensions before pullbacks.
- Manage risk: Exit overextended positions to avoid reversals.
- Spot reversals: Identify key turning points with RME and candlestick patterns.
Whether trading individual stocks or index ETFs, Relative Measured Extension ensures you stay disciplined and capitalize on the best time to sell stocks, while avoiding overextended moves.


