

Last Updated:
June 20, 2024


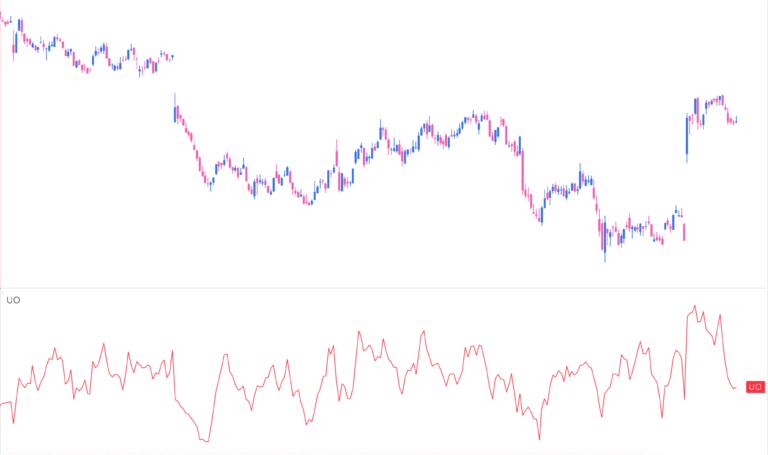
What is the Ultimate Oscillator?
Larry Williams built the Ultimate Oscillator in 1976. It showed up in Stocks & Commodities in 1985. Like most good ideas, it started as a fix: Williams wanted a momentum oscillator that wouldn’t trip over itself in strong trends.
Most oscillators use one timeframe. So they look great when a trend starts, then throw bearish divergences and overbought readings too soon. The Ultimate Oscillator avoids this by tracking three timeframes (7, 14, and 28 periods) at once.
In other words: less noise, more signal.
How it Works
At its core, the Ultimate Oscillator measures buying pressure. Strong buying pressure pushes it higher. Weak buying pressure drags it lower. Simple.
But here’s what makes it smarter than a standard momentum oscillator:
- It blends short, medium, and long-term views
- It weights them (short-term gets more weight, long-term less)
- It smooths out the false signals that kill single-timeframe indicators

The Formula (No Frills)
Here’s how to calculate it:
- Buying Pressure (BP)
BP = Close – min(Low or Previous Close) - True Range (TR)
TR = max(High or Previous Close) – min(Low or Previous Close) - Averages
- Average7 = (7-period BP sum) / (7-period TR sum)
- Average14 = (14-period BP sum) / (14-period TR sum)
- Average28 = (28-period BP sum) / (28-period TR sum)
- Ultimate Oscillator (UO)
UO = 100 * [(4 * Average7) + (2 * Average14) + Average28] / 7
That’s it. No black box here.
Why Use It?
Single-timeframe oscillators have a bad habit:
- They jump early in trends
- They throw divergences while price keeps trending
You end up exiting too soon or fading strength. Not ideal.
The Ultimate Oscillator reduces this by factoring in longer trends. It still responds to short-term moves, but it won’t overreact when the bigger trend is intact.
Trading with the Ultimate Oscillator
Williams designed it to trade divergences. Specifically:
Bullish Divergence (Buy Signal)
- Price makes a lower low
- UO makes a higher low (below 30 at the low)
- UO then rises above the high during the divergence
Bearish Divergence (Sell Signal)
- Price makes a higher high
- UO makes a lower high (above 70 at the high)
- UO then drops below the low during the divergence
For a different Larry Williams tactic, check out the Oops Reversal Entry Setup.
What to Watch For
- UO readings below 30 = potential oversold
- UO readings above 70 = potential overbought
- Divergences matter more than static readings
- Adjust parameters if your market is too choppy or too smooth
Like any tool, don’t trade it blind. Use it with other confirmations.
The Quirks (And Why You’ll Like Them)
- The weighting matters. The 4-2-1 blend keeps you from chasing false setups.
- It handles fast markets well. Strong trends won’t instantly trigger divergences.
- It stays simple. You can run this on anything: stocks, futures, crypto, pick your poison.
To complement this, consider launch pad setups for early entries when momentum builds.
The Bottom Line
The Ultimate Oscillator fixes what most momentum tools miss: time. By blending three timeframes, it cuts down on false divergences and adapts better to trends.
Is it the only thing you need? No. But it’s one of the cleaner momentum reads out there.
Frequently asked questions

Related articles
Explore relevant educational content & features.
-

-

Use Relative Measured Extension To Sell Into Strength
September 16, 2025[kt_reading_time] -
3 Must-Know Mike Webster Indicators That Could Transform Your Trading
August 7, 2025[kt_reading_time] -
