

Last Updated:
May 1, 2024


What Are Fibonacci Retracement Levels?
Fibonacci retracement levels help you spot where a stock or asset might pause or reverse during a price move. Traders use these levels to make better decisions about when to enter or exit a trade. The idea is based on a number pattern called the Fibonacci sequence, which also shows up in nature, art, and architecture.
These levels don’t predict the future. But they do show where price changes are likely to slow down, reverse, or bounce—especially during pullbacks in a trend.
Key Levels You Need to Know
Here are the Fibonacci retracement levels most traders use:
- 23.6%
- 38.2%
- 50% (not part of the Fibonacci sequence, but commonly used)
- 61.8%
- 78.6%
Each level acts as a potential support (if the trend is up) or resistance (if the trend is down).
How Fibonacci Levels Work
- Identify the trend: Is the price generally going up or down?
- Mark the swing high and swing low: These are the recent peaks and valleys.
- Apply the retracement tool: Most charting platforms will draw the levels for you.
Once drawn, these lines show where a pullback might pause or reverse. For example:
- A 38.2% pullback usually means the trend is still strong.
- A 61.8% pullback could signal a deeper correction or even a reversal.
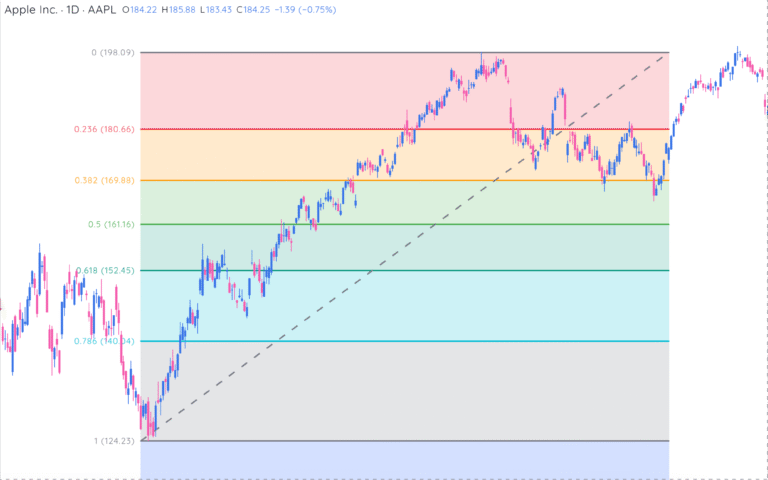
Real-World Example: AAPL Fibonacci Retracement
Let’s look at a real case using Apple Inc. (AAPL) on the daily chart:
Symbol: AAPL
Company Name: Apple Inc

In this example:
- Swing low: $124.23
- Swing high: $198.09
- Price range: $198.09 – $124.23 = $73.86
Based on this, the Fibonacci retracement levels are drawn at:
- 23.6%: $180.66
- 38.2%: $169.88
- 50%: $161.16
- 61.8%: $152.45
- 78.6%: $140.04
How It Played Out
- After reaching the high near $198, the price began to retrace.
- It dipped through the 23.6% and 38.2% levels, showing weakening momentum.
- Notice how it paused and rebounded multiple times near the 61.8% level at $152.45, which is a classic Fibonacci support zone.
- As price regained strength, it climbed back above 38.2%, briefly challenged 23.6%, and is now trading above $211.
This shows how the retracement levels acted as potential support zones during pullbacks and gave traders clues on when momentum might return.
Trading Approach Here
- Entry: A trader might go long near the 61.8% level after confirmation (e.g. bullish candle or RSI reversal).
- Stop-loss: Just below $152.45 (next retracement level).
- Target: Near previous high at $198.09 or using extension levels like 161.8%.
This example highlights how Fibonacci levels offer structured zones to plan trades without guessing.
How Traders Use Fibonacci Levels
1. Entry Points
- In an uptrend, look for pullbacks to 38.2%, 50%, or 61.8%.
- Wait for confirmation (like bullish candlestick patterns or RSI) before entering.
2. Stop-Loss Placement
- Place it just beyond the next retracement level to give the trade room but avoid big losses.
3. Profit Targets
- Use Fibonacci extensions like 100%, 161.8%, or 261.8% to set exit points once the trend continues.
Combine With Other Tools for Better Results
Fibonacci retracement alone isn’t enough. Combine it with:
- RSI and MACD for momentum
- Trend lines for direction
- Candlestick patterns for confirmation
These combinations help reduce false signals and make your strategy more reliable.
Where Fibonacci Levels Fall Short
Fibonacci retracement isn’t perfect. Here’s why:
- Subjectivity: Different traders may choose different swing highs and lows.
- False signals: Price can break through levels without pausing.
- Confirmation bias: Traders may force levels to fit their ideas.
- Works best in trends: In choppy or sideways markets, it’s less effective.
- Too many levels: With several retracement lines close together, it’s hard to know which one will hold.
Common Criticisms
Some argue Fibonacci tools are:
- Too subjective: Traders draw levels differently.
- Not backed by science: Nature-based ratios don’t control the market.
- Self-fulfilling: They work because many traders believe they do.
Still, when used wisely, they offer a useful framework—just not a crystal ball.
Pros and Cons
Pros
- Helps find support and resistance
- Useful in trending markets
- Aids in setting stop-loss and profit targets
- Works across different time frames
- Pairs well with other tools
Cons
- Not predictive by itself
- Subject to user error
- Can create confusion
- Doesn’t work well in sideways markets
The Bottom Line
Fibonacci retracement levels are a solid part of a trader’s toolkit—but only when used with other analysis methods. They help you identify potential turning points in price, but they don’t guarantee outcomes. If you’re going to use them, do it with confirmation, context, and caution.
Frequently asked questions

Related articles
Explore relevant educational content & features.
-

-

Use Relative Measured Extension To Sell Into Strength
September 16, 2025[kt_reading_time] -

3 Must-Know Mike Webster Indicators That Could Transform Your Trading
August 7, 2025[kt_reading_time] -
