Last Updated:
October 6, 2025
Why Watching Stocks from the Open Gives Traders an Edge
The opening bell sets the tone for the entire trading day. Watching stocks from the open gives you a front-row seat to the market’s first moves – helping you spot opportunities and manage risk before most traders catch on.
By tracking price action, volume, and a few key metrics right from the start, you can ride the day’s momentum instead of reacting to it. If you know how to read that early action, it can give you a serious advantage.
Price action in the first 30–60 minutes often shows whether buyers or sellers are in control.
- A stock breaking above key resistance at the open? That’s a bullish sign.
- A stock gapping up but fading quickly? That could signal weakness.
Stocks that gap up or down can offer big opportunities.
- If a gap holds, it shows strength.
- If it fills quickly, momentum may be fading or reversing.
Big funds often move early, which shows up as sharp price shifts or volume spikes at the open. If you can spot these moves in real-time, you can ride the wave rather than fight it.
Focusing on the open helps you time entries and exits with more precision while avoiding traps caused by short-term volatility.
How Pre-Market Analysis Sets You Up for Success
Think of pre-market analysis as your warm-up. Before the market opens, you can get a sneak peek into what’s driving the day. The goal here isn’t to predict the market – it’s to narrow your focus.
Here’s what to track before the bell:
- Pre-market % change (±2% or more): Big moves often hint at important news or earnings.
- Volume vs. average: Look for pre-market volume that’s already above 5% of the 20-day average. That’s a sign of early interest.
- Gap size: How far above or below the prior close is the stock opening? Large gaps mean volatility—and opportunity.
Tools to use:
- Pre-market gainers and losers screeners – to spot which stocks are already moving.
- News dashboards – to quickly check earnings, analyst upgrades/downgrades, and press releases.
- Intraday + daily chart view – to visualize where the stock is in its overall trend.
Create a daily watchlist before the open using these criteria so you’re not reacting – you’re executing.
How to Watch Stocks From the Open
When the bell rings, it’s game time. This is when the market reveals its first real signals of the day – and if you’re prepared, you can capitalize on high-probability moves.
That’s why you need a system to filter out the noise and zero in on what matters: volume, direction, and relative strength.
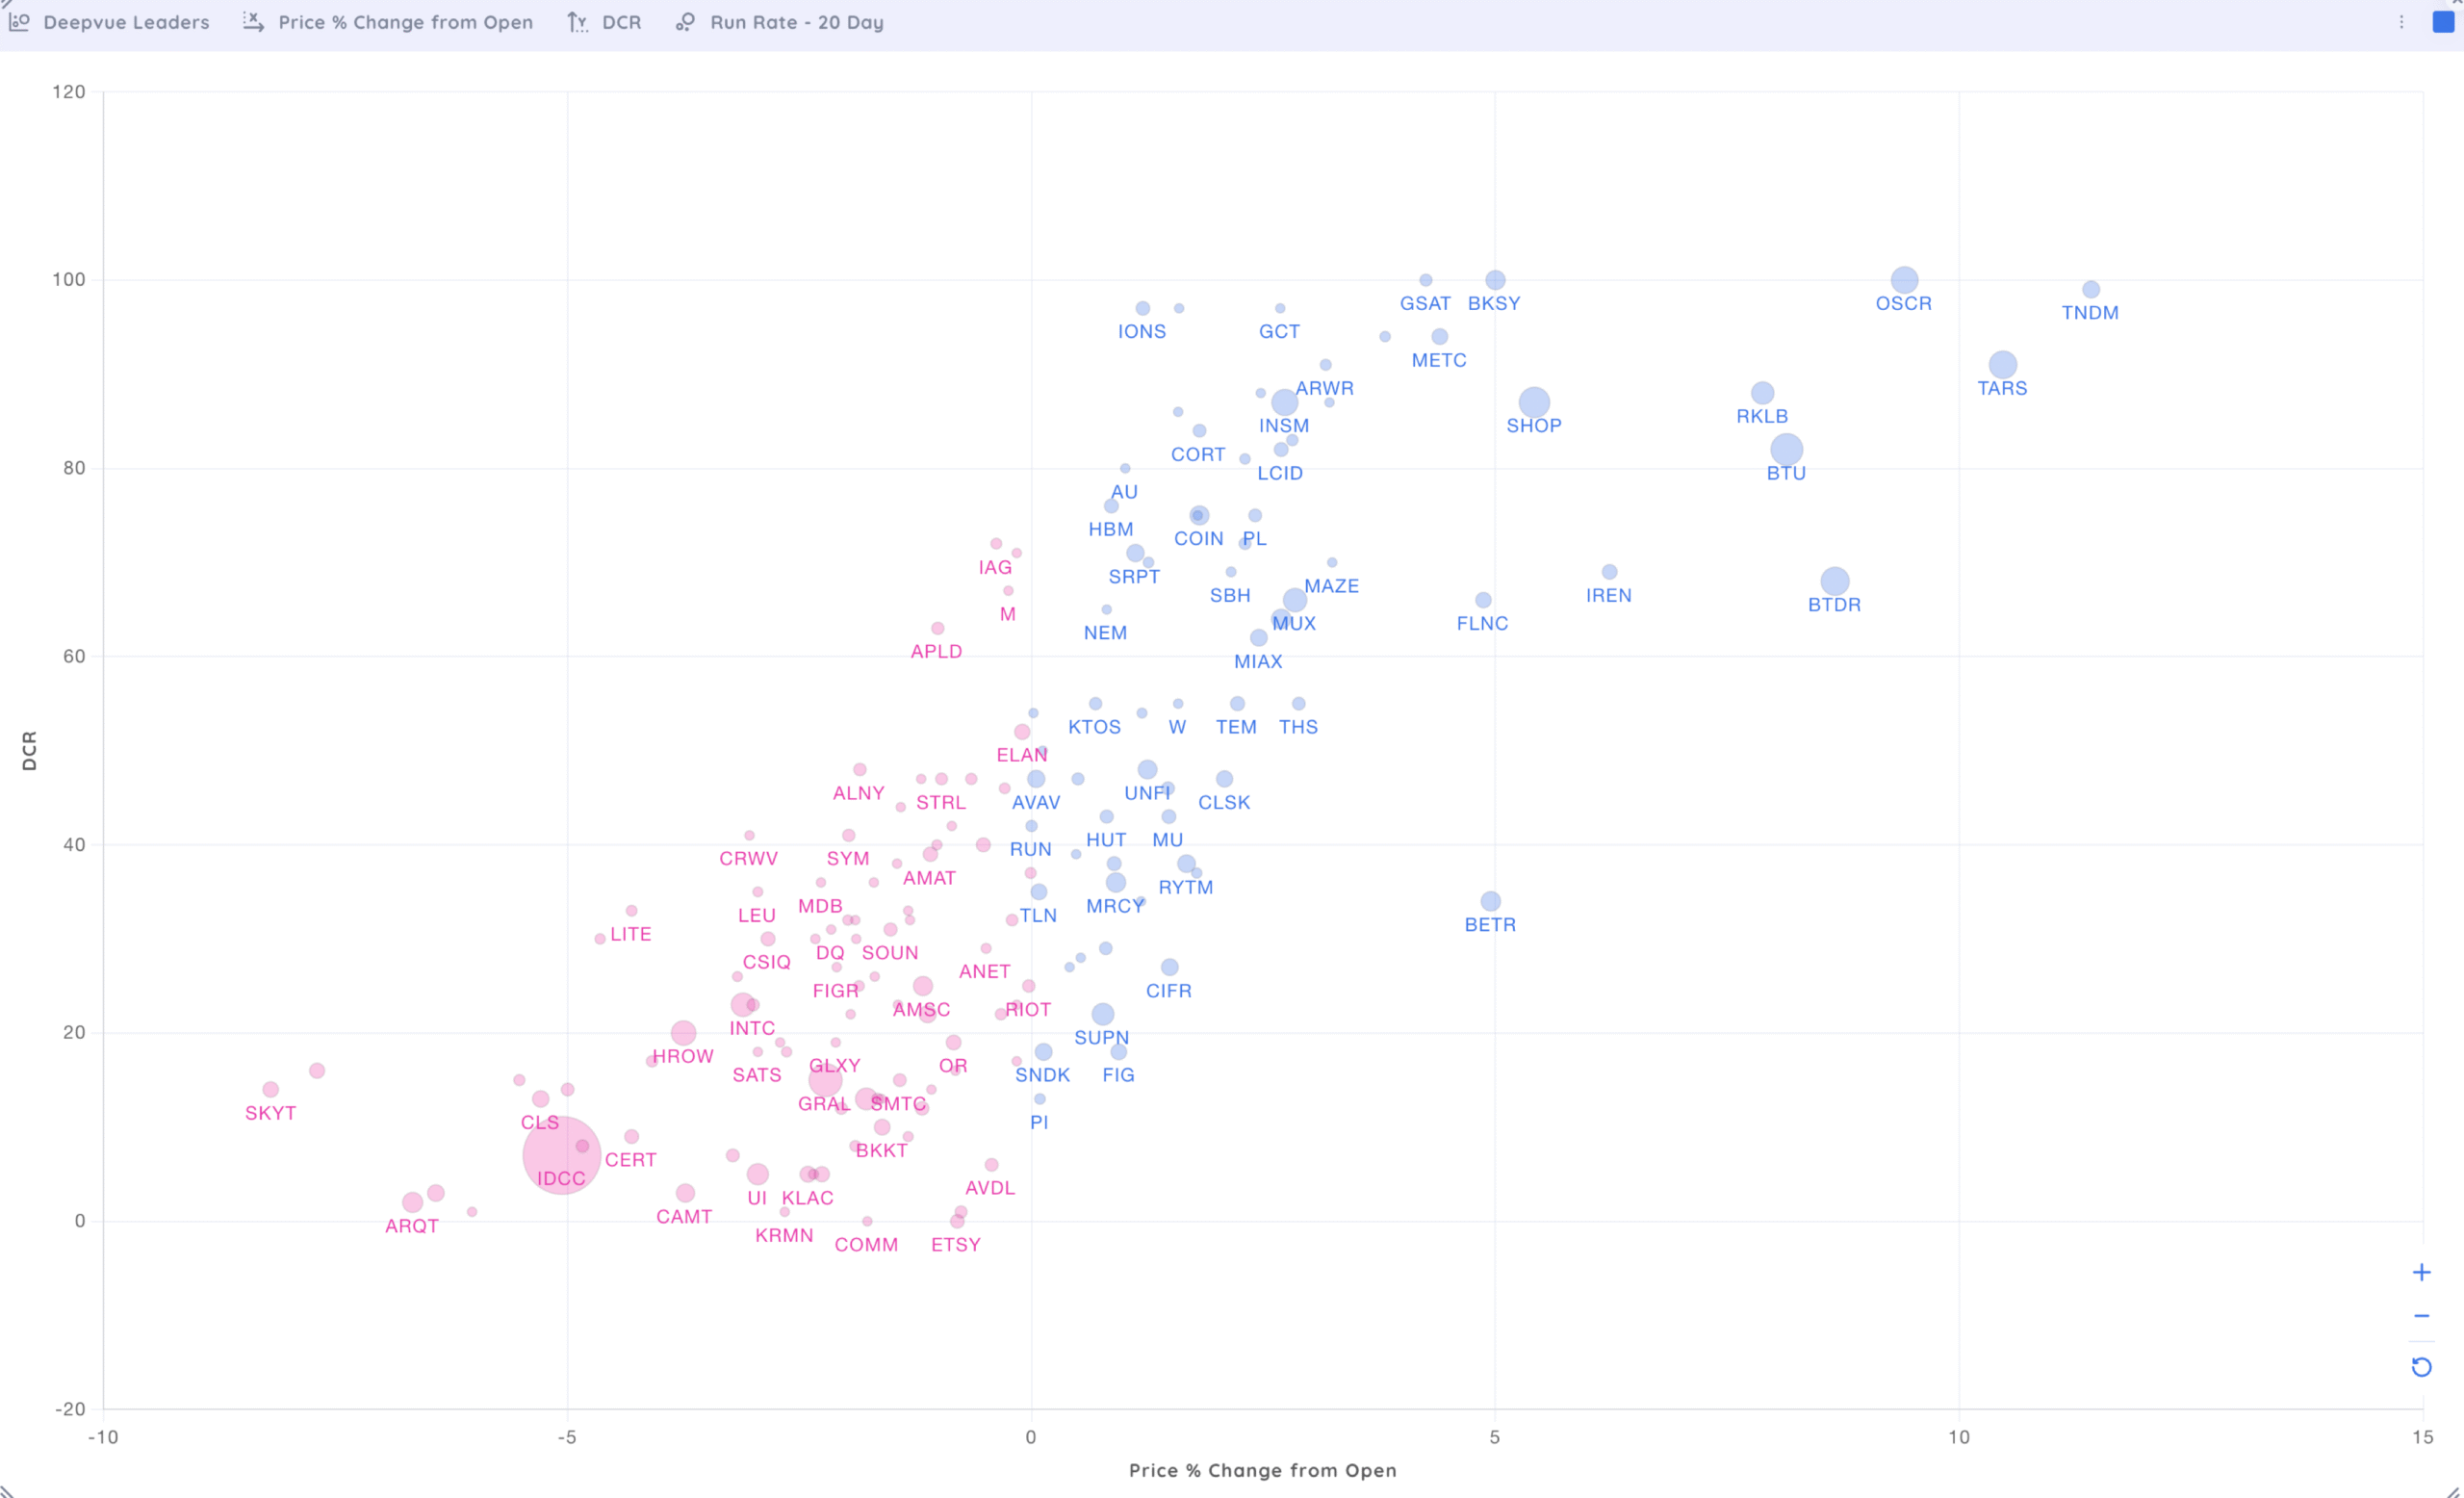
Bubble charts – spot high-impact movers at a glance
What it does: Bubble charts visually map stocks based on metrics like price change, volume, or both. Each “bubble” represents a stock, and its size or position shows how unusual the activity is.
Why it’s useful:
- Helps you instantly spot outliers – stocks making big moves in price or volume.
- Ideal for tracking your focus list or gap-up screeners.
- Visually highlights where momentum is building and which names are worth a deeper look.
How to use it:
- Plot % change from open on one axis and Daily Closing Range (DCR) on the other with volume run rate as the bubble size.
- Look for large bubbles in the top-right quadrant – these are your strongest movers with elevated volume.
- Click on a bubble to view price charts.
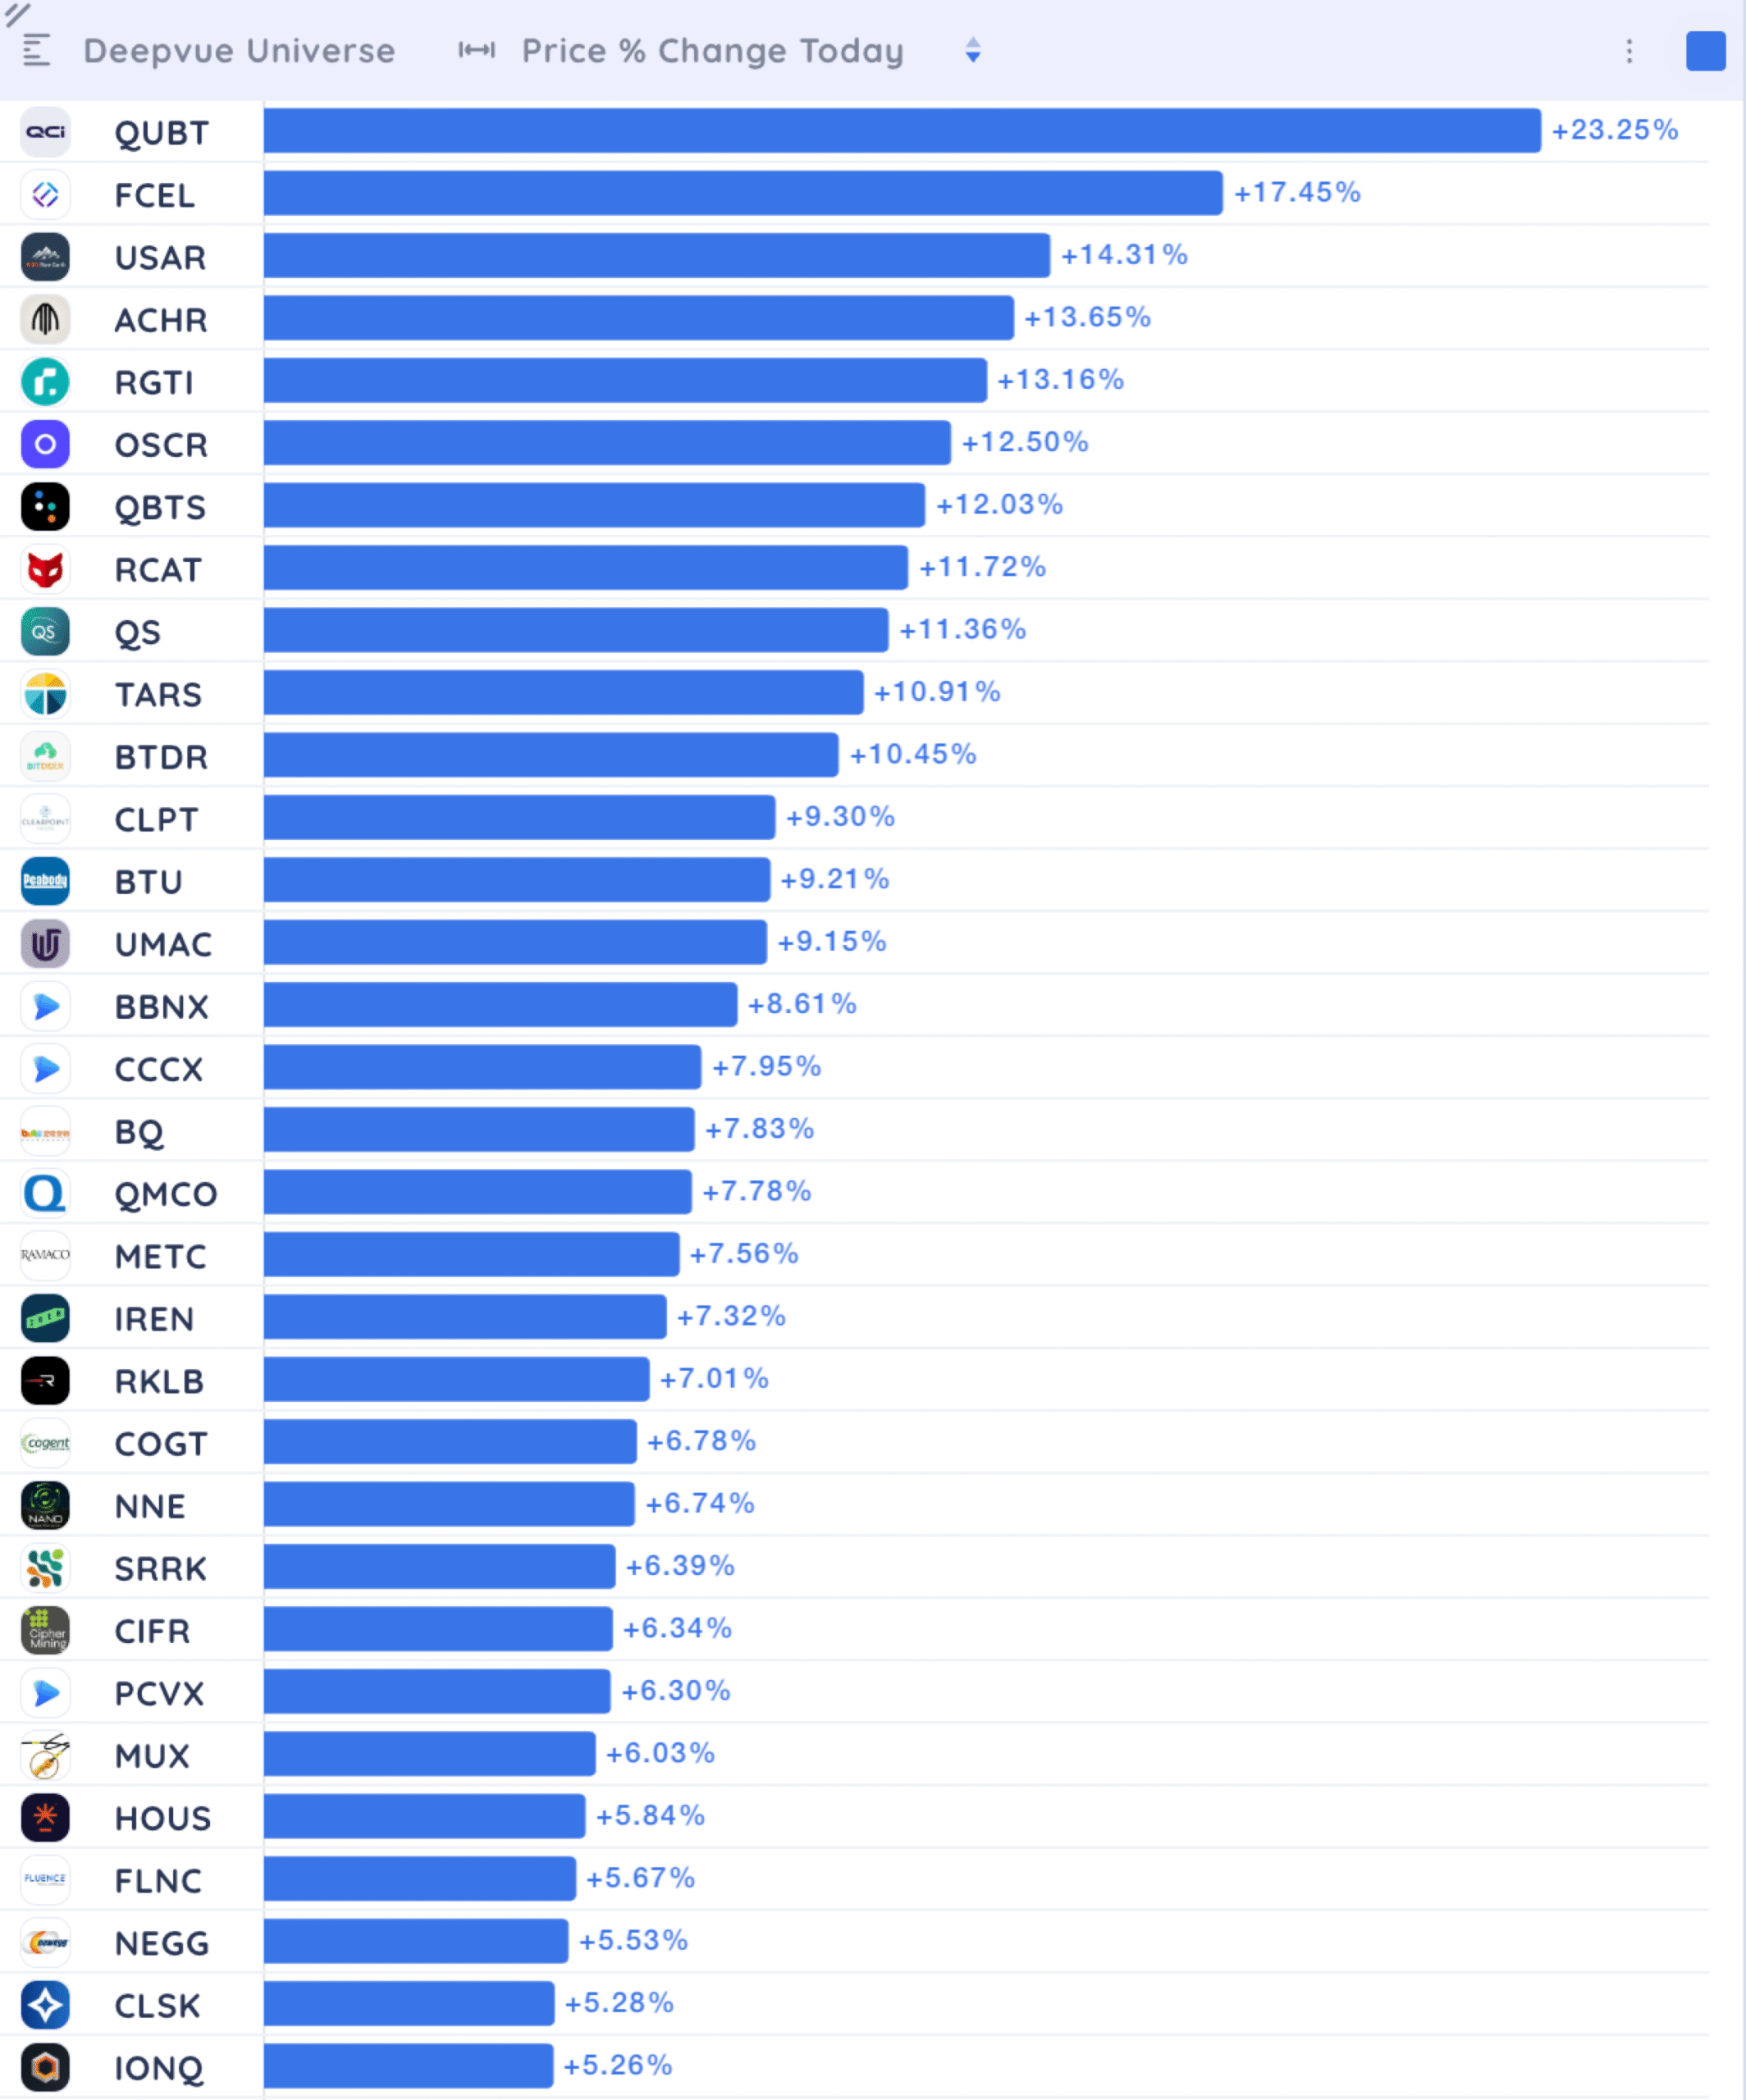
Performance charts – rank stocks by real-time momentum
What it does: Performance charts let you rank and sort stocks by % change from the open, giving you a clear picture of which names are leading or lagging right now.
Why it’s useful:
- Surfaces the top intraday gainers and losers with just a quick glance.
- Helps confirm relative strength – which stocks are outperforming their peers or sector.
- Useful for building momentum-based watchlists as the session develops.
How to use it:
- Sort by % change from open rather than from the previous close. This gives a more accurate read on early-session strength or weakness.
- Combine with pre-market data to see if early leaders are holding their gains or fading.
- Cross-reference with charts to validate setups like breakouts, pullbacks, or trend continuations.
💡 Pro Tip: Watch for stocks making higher highs after the first 15 minutes—these often attract breakout traders and algorithmic buyers.
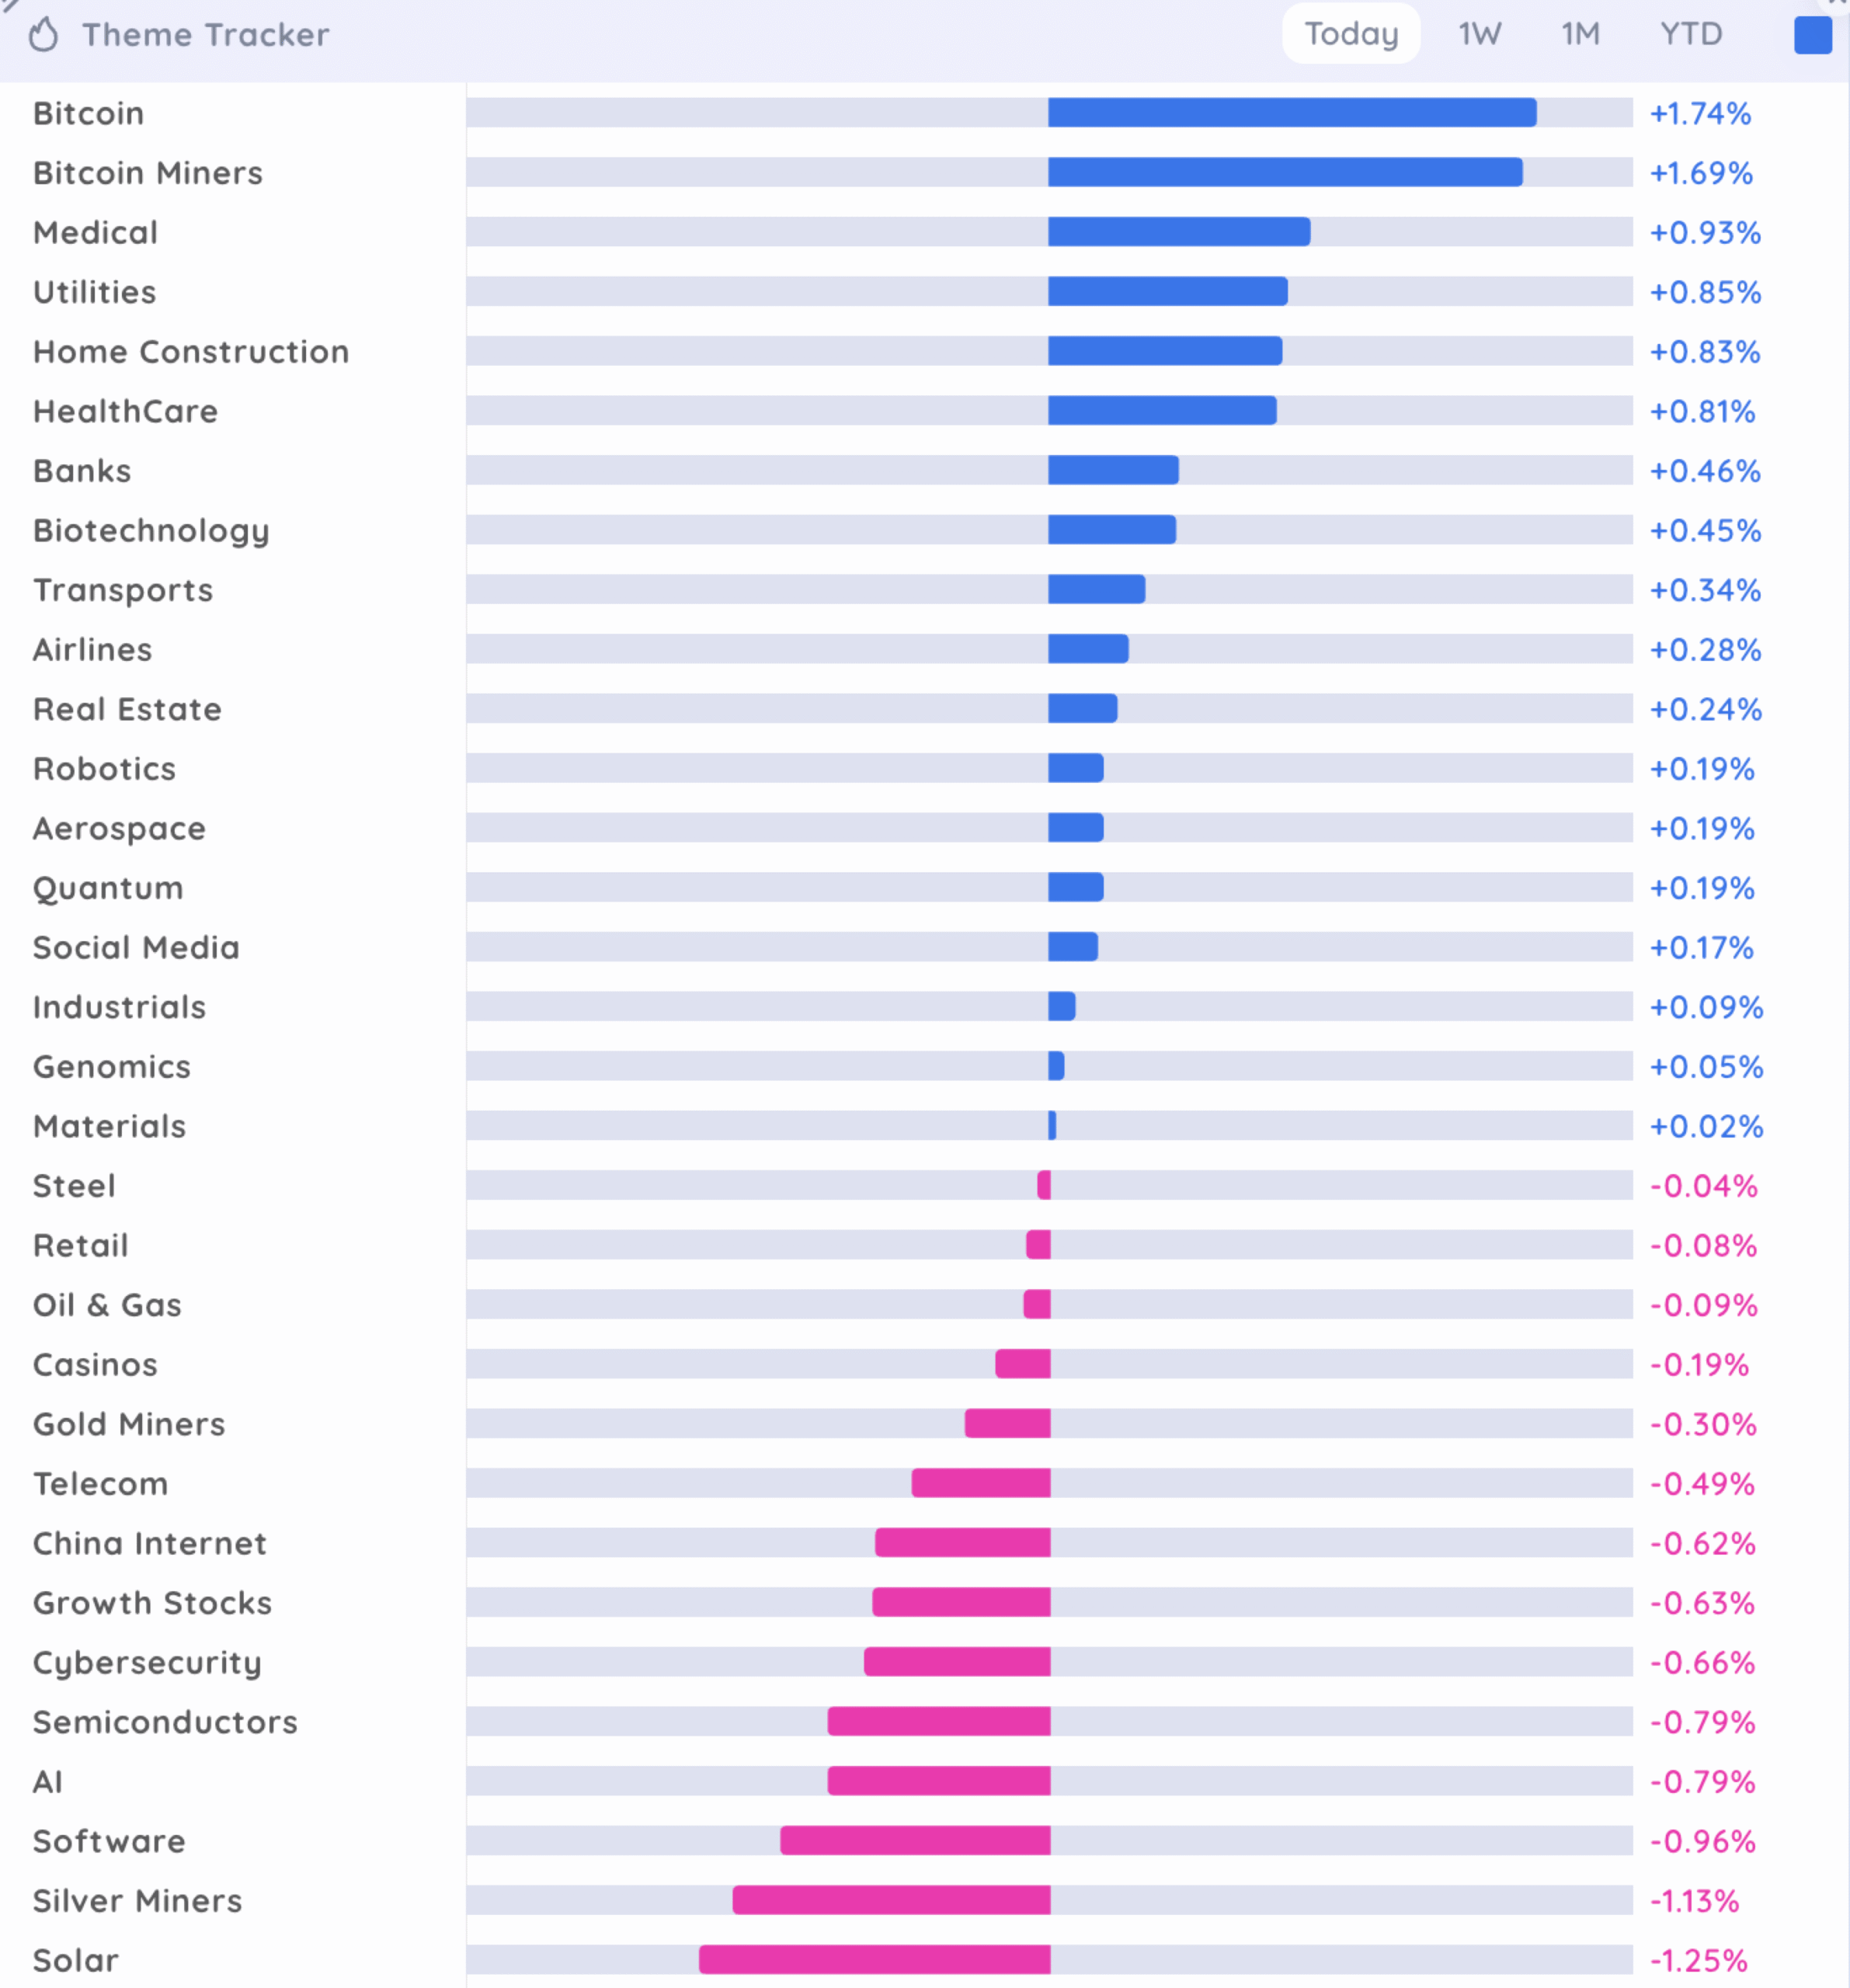
Theme tracker – stay aligned with sector and industry rotation
What it does: A theme tracker monitors sector and industry performance throughout the day. It tells you where capital is flowing and where to look for trade ideas.
Why it’s useful:
- Identifies sector rotation in real time, which is key to understanding market dynamics.
- Helps you avoid fighting the tape by trading against the dominant trend.
- Lets you prioritize strong sectors, which increases the odds of your trade working.
How to use it:
- Look for sectors that are outperforming – these are usually where institutions are focusing.
- Once a sector is identified, drill down into the top-performing stocks within that group.
Screeners to spot high-probability stocks from the open
Once you’ve got your dashboard and charting tools in place, the next step is to filter your universe of stocks using powerful “From the Open” screeners. These allow you to focus on stocks that meet specific, high-conviction criteria so you’re not chasing noise, but targeting real momentum with solid context behind the moves.
Here are the top screening criteria and what they tell you:
- Gap Up ≥ 2%: A gap up of 2% or more from the previous close usually signals that something important has happened – think positive earnings, major news, or a bullish analyst call.
- Unfilled Gap: Not all gaps hold. But when a stock gaps up and doesn’t quickly fill that gap, it tells you buyers are in control and defending higher prices.
- Open = Low: When a stock’s opening price is also the day’s low, it means there was immediate buying interest. No one let it dip, and buyers rushed in right away.
- Run Rate > 150%: This measures how current intraday volume stacks up against the stock’s average volume over the last 20 days.
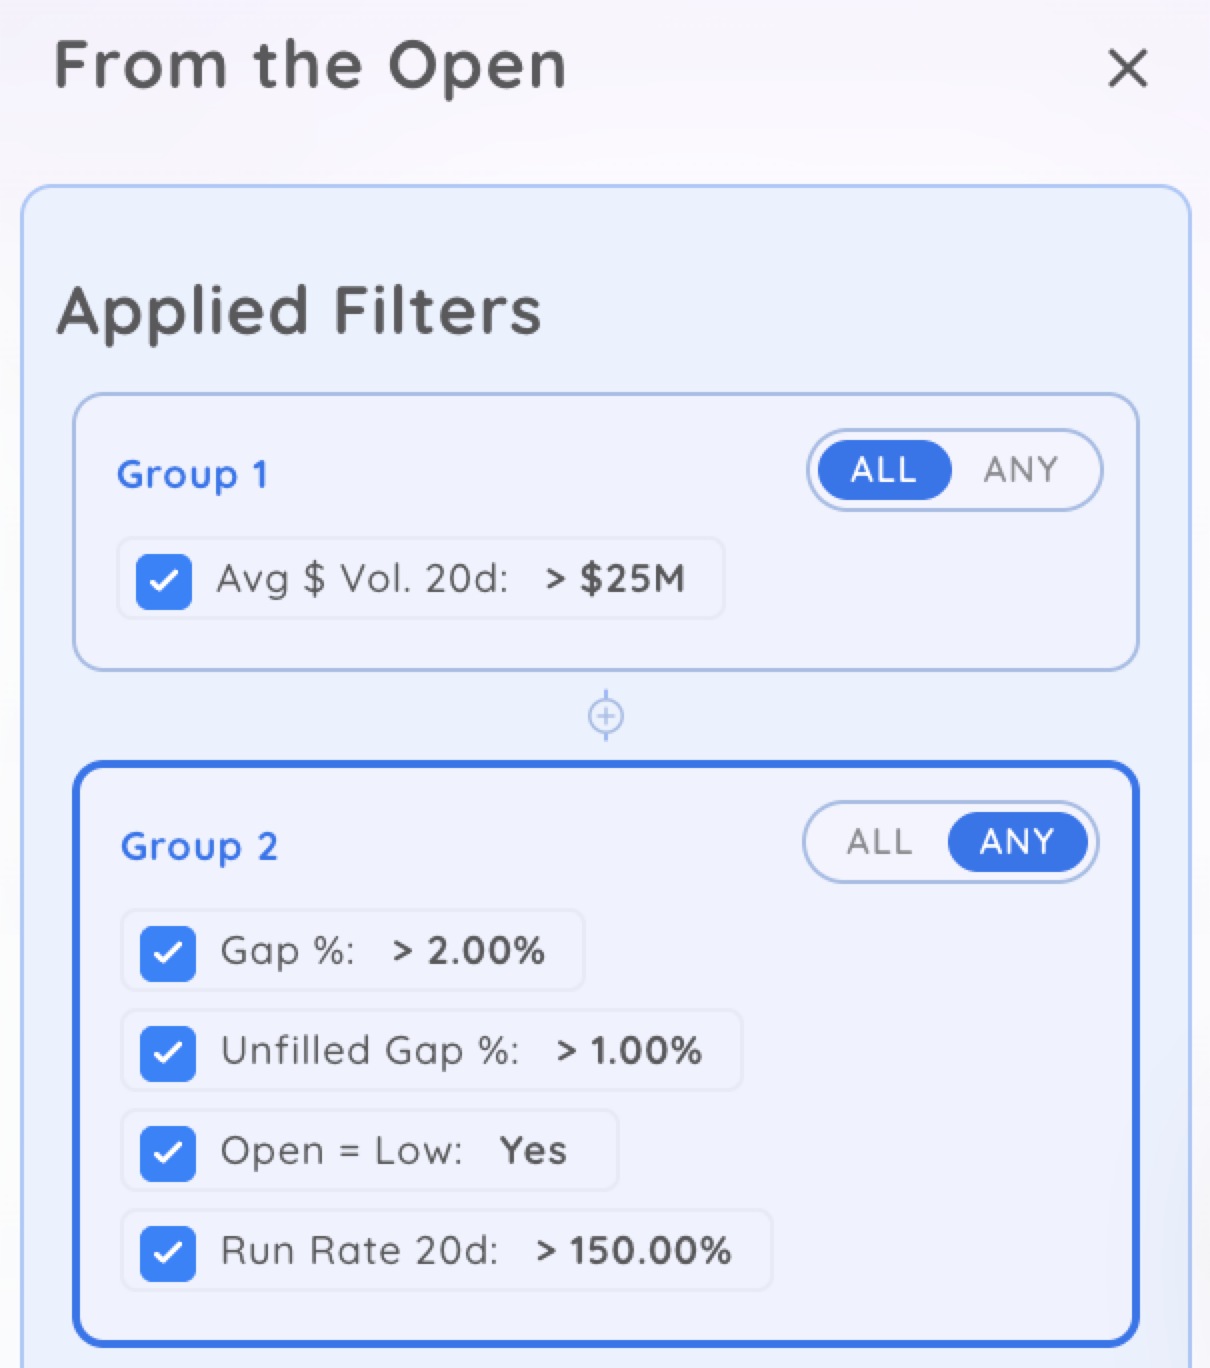
This type of screener-based approach makes it easier to build a repeatable morning routine. Combine it with bubble charts and performance charts, and you’ll be locked in on the day’s best opportunities.
How to Set Up a Column Set to Watch Stocks From the Open
A clean, focused column set makes it easy to scan for the right data. Here’s what to include:
- From the Open % Change – Measures early performance since the bell.
- Daily Closing Range (DCR) – Shows where the price is within the day’s high and low. A high DCR (80%+) signals strength.
- 20-Day Volume Run Rate – Tells you if the current volume is elevated compared to the average. Run rates >100% mean big money might be involved.
- Gap Size – Helpful for tracking how much the stock opened above or below the prior close.
- Relative Strength – Gives a broader context on how a stock is performing against the market or sector.
Organize your columns in a way that lets you sort stocks from the open by opportunity.
How to Set Up a Deepvue Dashboard to Watch Stocks From the Open
A well-built Deepvue dashboard keeps your focus on high-quality setups without jumping between charts or tabs.
Here’s a clean, effective layout to use every morning:
Set your axes and sizing like this:
- X-Axis: Price % change from the open
- Y-Axis: Daily Closing Range (DCR)
- Bubble Size: Volume Run Rate
This combo shows which stocks are moving with strength and heavy volume. Use two views:
- Your Top Focus Watchlist for high-priority names
- The Deepvue Leaders Screener to catch broader market strength
Add a daily timeframe chart to see the bigger picture.
- Is the stock gapping into resistance?
- Breaking out from consolidation?
- Sitting in no man’s land?
This helps filter out weak setups that look good only on an intraday chart.
Add a performance view sorted by % change from the open to quickly spot which stocks are leading or falling behind. Use this alongside your bubble charts to confirm strength.
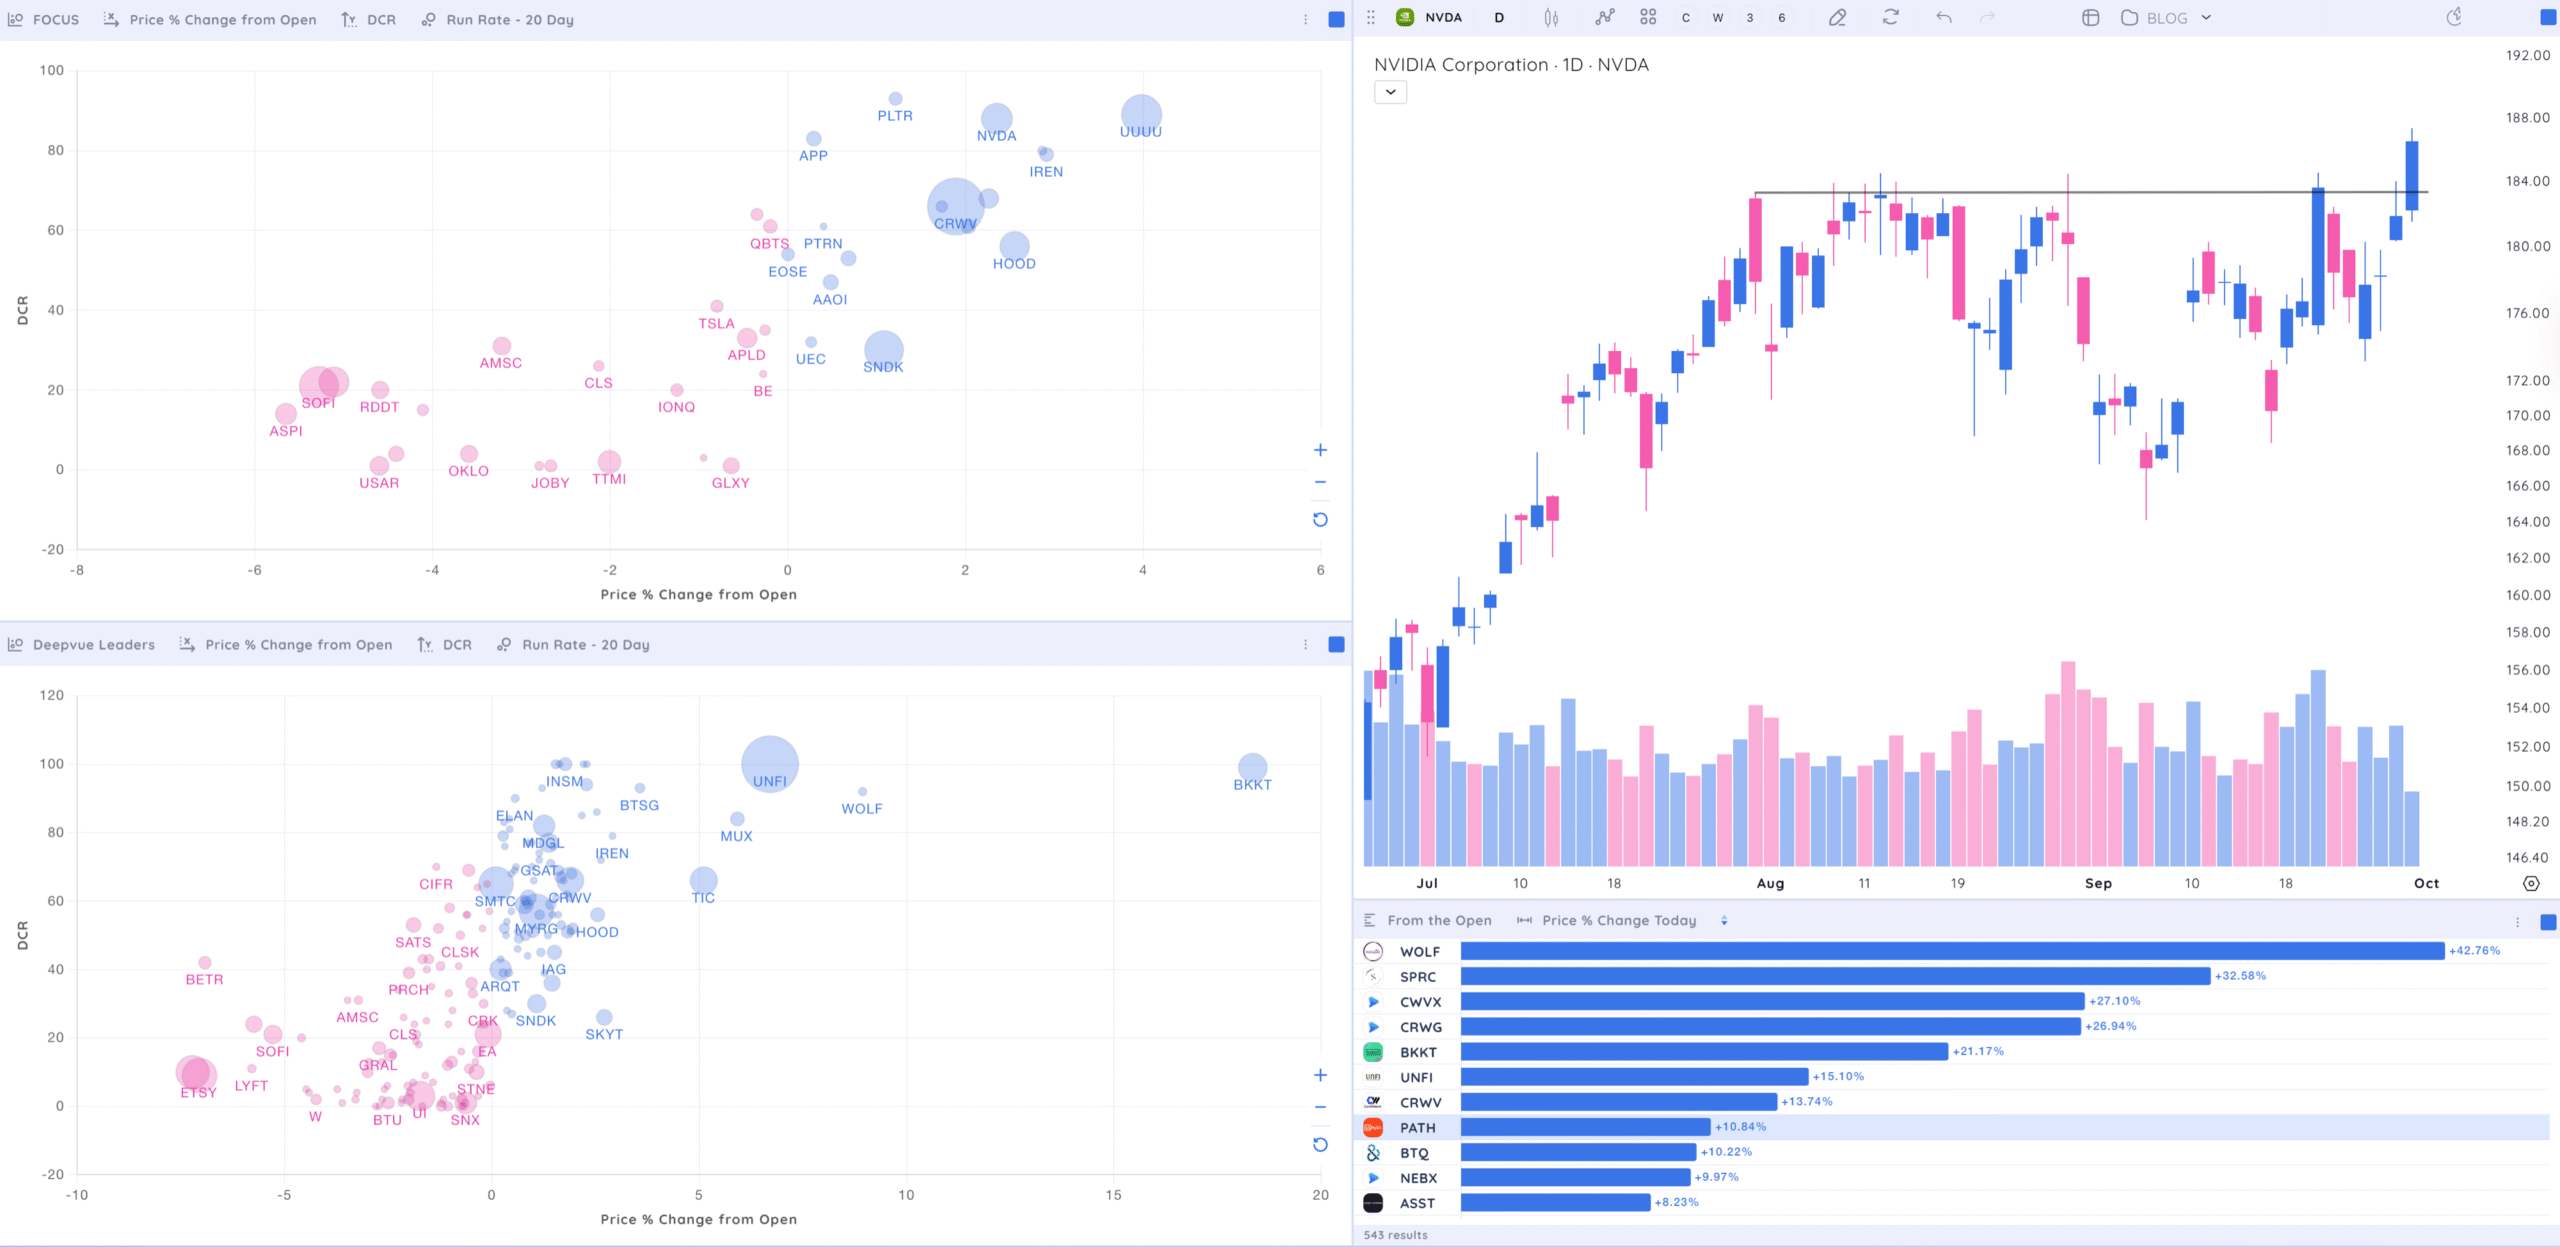
Structure your dashboard like this:
- Top Left: Bubble chart (Top Focus List)
- Bottom Left: Bubble chart (Screener like Deepvue Leaders)
- Top Right: Daily price chart
- Bottom Right: Performance chart
Save this layout as “From the Open” so it’s ready to launch every trading day. This setup keeps your process tight, visual, and focused on the right names from the start.
Copy this layout or experiment on your own. Use Bubble and Performance Charts with various watchlists and screeners to focus on the best-performing stocks from the open.
How Watching Stocks From the Open Gives a Sense of the Trend
Tracking stocks from the open isn’t just about fast trades – it’s about understanding what’s driving the market and using data to make better decisions.
Here’s a quick recap of why this strategy works:
- You catch early trends. The open gives you a live read on sentiment, strength, and direction.
- You avoid chasing. Pre-market prep lets you focus on the best setups.
- You trade with the pros. Tools like run rate and gap screeners help you follow institutional moves.
- You stay organized. Dashboards and columnsets keep your workflow clean and focused.
Watching stocks from the open is a habit worth building. It’s not just about reacting – it’s about being prepared and executing with confidence.
Whether you’re swing trading, day trading, or just tracking momentum, this approach helps you focus on what matters most right when it matters most.


