Last Updated:
October 28, 2025
What is the Post-Market and Why Track It?
The post-market is the trading session after the regular market closes at 4:00 p.m. EST, typically running until 8:00 p.m., unless your platform and the stock offer 24-hour trading. During this time, you can still buy and sell stocks, but only with limit orders, since market makers aren’t active.
Like pre-market trading, outside of normal trading hours has lower liquidity, wider bid-ask spreads, and more volatility. That’s because fewer people are trading, and volume is down.
So why track it? It gives you a sneak peek at how stocks react to news released after hours, like earnings reports, major announcements, or economic data.
These early reactions often set the tone for the next trading day. For most retail traders, it’s less about trading and more about watching which stocks are moving, why they’re moving, and what that might mean for the morning.
Why Track the Post-Market?
Keeping an eye on stocks after the close gives you an edge by helping you spot big developments that could drive tomorrow’s price action. Here’s why it’s worth your time:
Track earnings reactions
Earnings are usually released after hours, and stocks can move fast depending on the results. If a stock jumps on strong numbers and high volume, that could signal more upside ahead.
Spot other reactions to after-hours news
Big news – like mergers or global events – often breaks after 4:00 p.m. Watching how stocks respond in real time shows you how investors are feeling.
Manage risk better:
Post-market moves can be exaggerated due to low volume. Knowing where the price finds support or resistance after hours can help you stay cautious and avoid traps.
Gauge next-day momentum
Price action after hours helps you guess whether a move will continue or reverse when the market opens. Heavy volume often means big players are involved.
Identify trade setups
Big movers after the close often point to potential trades for tomorrow – momentum plays, reversals, or episodic pivot breakouts you can plan for in advance.
Understand overall sentiment
Watching ETFs like SPY or QQQ after hours gives you a sense of how the broader market might open.
How to Screen the Post-Market Effectively
Not every after-hours move is worth your attention. The goal is to filter for meaningful activity – especially from earnings or news. Here are the key metrics to watch:
Key Metrics to Watch in the Post-Market
Here are the top data points you’ll want to track after the close:
- Post-market % change
Look for stocks moving 2% or more. These swings often signal a news-driven move. - Gap up or gap down
A gap up means the stock is trading above its close, while a gap down means it’s below. Both can highlight strong sentiment – especially if tied to earnings or news. - Post-market volume
Higher volume = higher conviction. Compare it to regular session volume to see if the move is legit. - Post-market volume vs. 20-day average
See how after-hours volume stacks up against the stock’s recent average. If it’s trading 5–10% or more of its average daily volume, it deserves a closer look. - Earnings reactions
Focus on stocks with fresh earnings reports. Those gapping up on heavy volume often attract institutional buyers and can trend for weeks.
Screening Tips to Improve Your Post-market Watchlist
To find high-probability setups fast, use these filters in Deepvue or a similar platform:
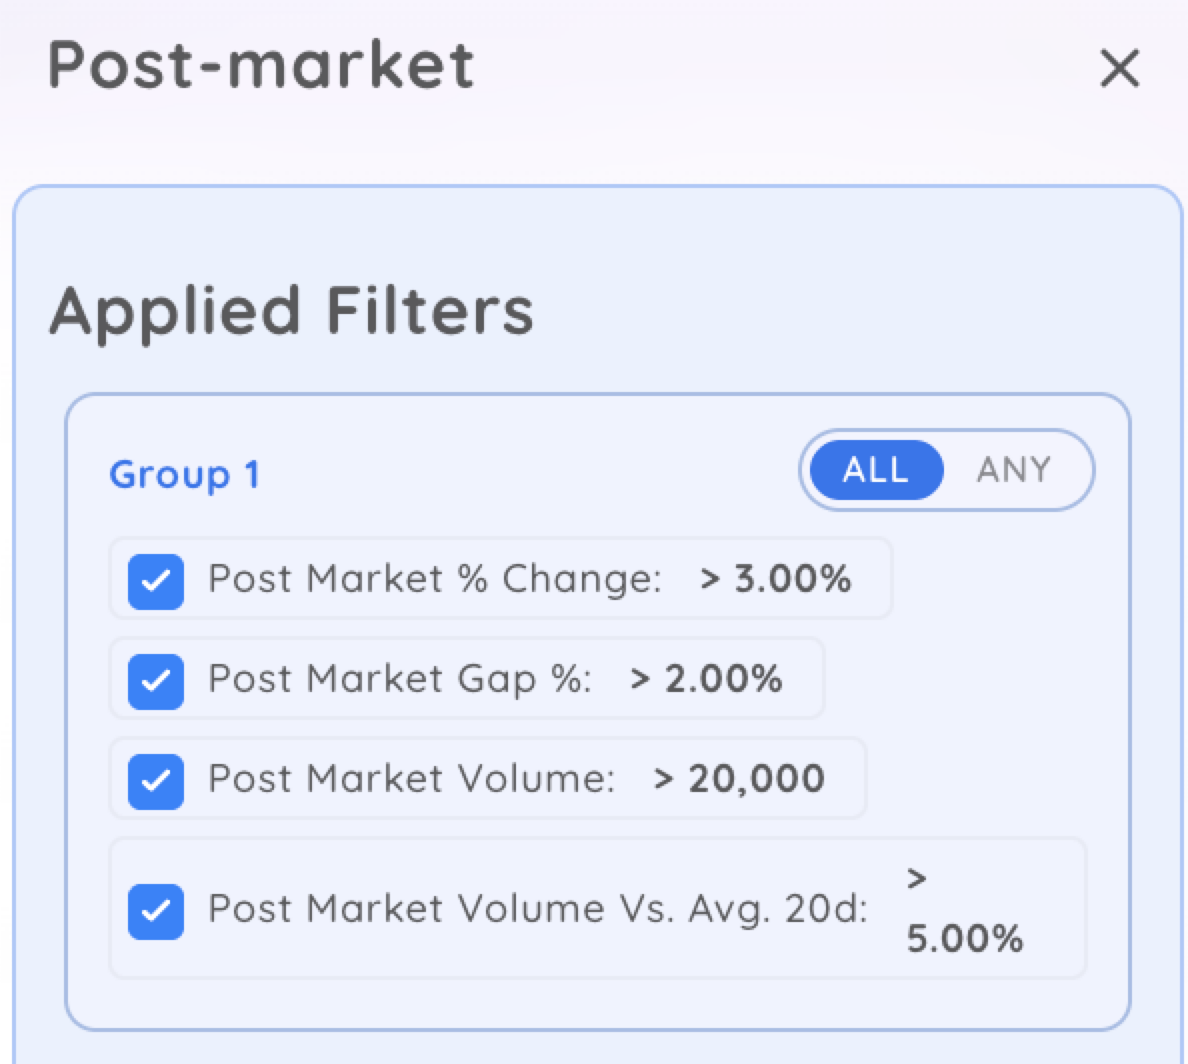
- Post-market % change: 3% or more
- Post-market volume: Above 20,000 shares
- Post-market volume vs. 20-day average: Above 5%
- Gap size: More than 2%
These settings help you zero in on the most active names.

Set up separate screeners for post-market gainers and losers so you can spot long and short opportunities faster.
How to Set Up a Column Set for Post-Market Data
A clean, focused column set is one of the fastest ways to cut through the noise and zero in on stocks that actually matter. Instead of flipping through charts or relying on gut instinct, your column layout gives you a real-time snapshot of the most important data points in one place.
Must-Have Data Points in Your Column Set
- Post-market % change: This shows how much a stock has moved (up or down) after the market closed, expressed as a percentage. It’s the quickest way to spot gainers and losers.
- Gap up/down: This tells you how far the stock has gapped from its closing price. A strong gap up (especially tied to earnings or news) might point to momentum for tomorrow. Gaps can also act as early setups for breakouts, reversals, or continuation trades.
- Post-market volume: A price move means nothing without activity behind it. This column shows how many shares traded after hours. Higher volume adds credibility to the move and may signal institutional interest.
- Volume vs. 20-day average: To understand if the post-market volume is meaningful, compare it to the stock’s average volume over the last 20 sessions. A stock trading 50,000 shares after hours might seem active, but if its average daily volume is 200,000, it’s only 25% of normal. Set a mental threshold: anything over 10% of average volume is worth a closer look.
- Last price: This is the current trading price. It helps you quickly assess how far the stock is from its regular session close, and whether it’s holding gains or fading the move.
- Earnings date: Add this column to flag stocks that have recently reported earnings or are about to. Many post-market moves are tied to quarterly results, so it’s helpful to know if a stock’s spike (or drop) is earnings-related.
Once you’ve added these columns, save your layout. This saves time and ensures you’re always working with the right data.
When reviewing your list, sort by post-market % change or post-market volume to bring the biggest movers to the top.
How to Set Up a Deepvue Dashboard for Post-Market Analysis….
Setting up a Deepvue dashboard takes just a few steps, and helps you prep smarter and move faster.
- Create a screener for gainers
- Post-market % change: > +3%
- Post-market volume: > 10,000 shares
- Volume vs. 20-day average: > 5%
- Save as: Post-Market Gainers
- Build a screener for losers
- Post-market % change < -3%
- Post-market volume > 10,000 shares
- Volume vs. 20-day average > 5%
- Save it as “Post-Market Losers”
- Add and organize column sets for consistency
- Use the column set mentioned above in both gainers and losers. You can also include fundamental data like revenue growth or profit margins for deeper context, especially if earnings are driving the move.
- Use charts to spot activity
- Intraday chart with extended hours: Use a 5-minute or 30-minute chart with extended trading enabled. This helps you spot patterns like breakouts or reversals forming in real time.
- Daily chart: Add a daily timeframe to give context. You’ll want to know if a gap is happening near support, resistance, or in the middle of a trend.
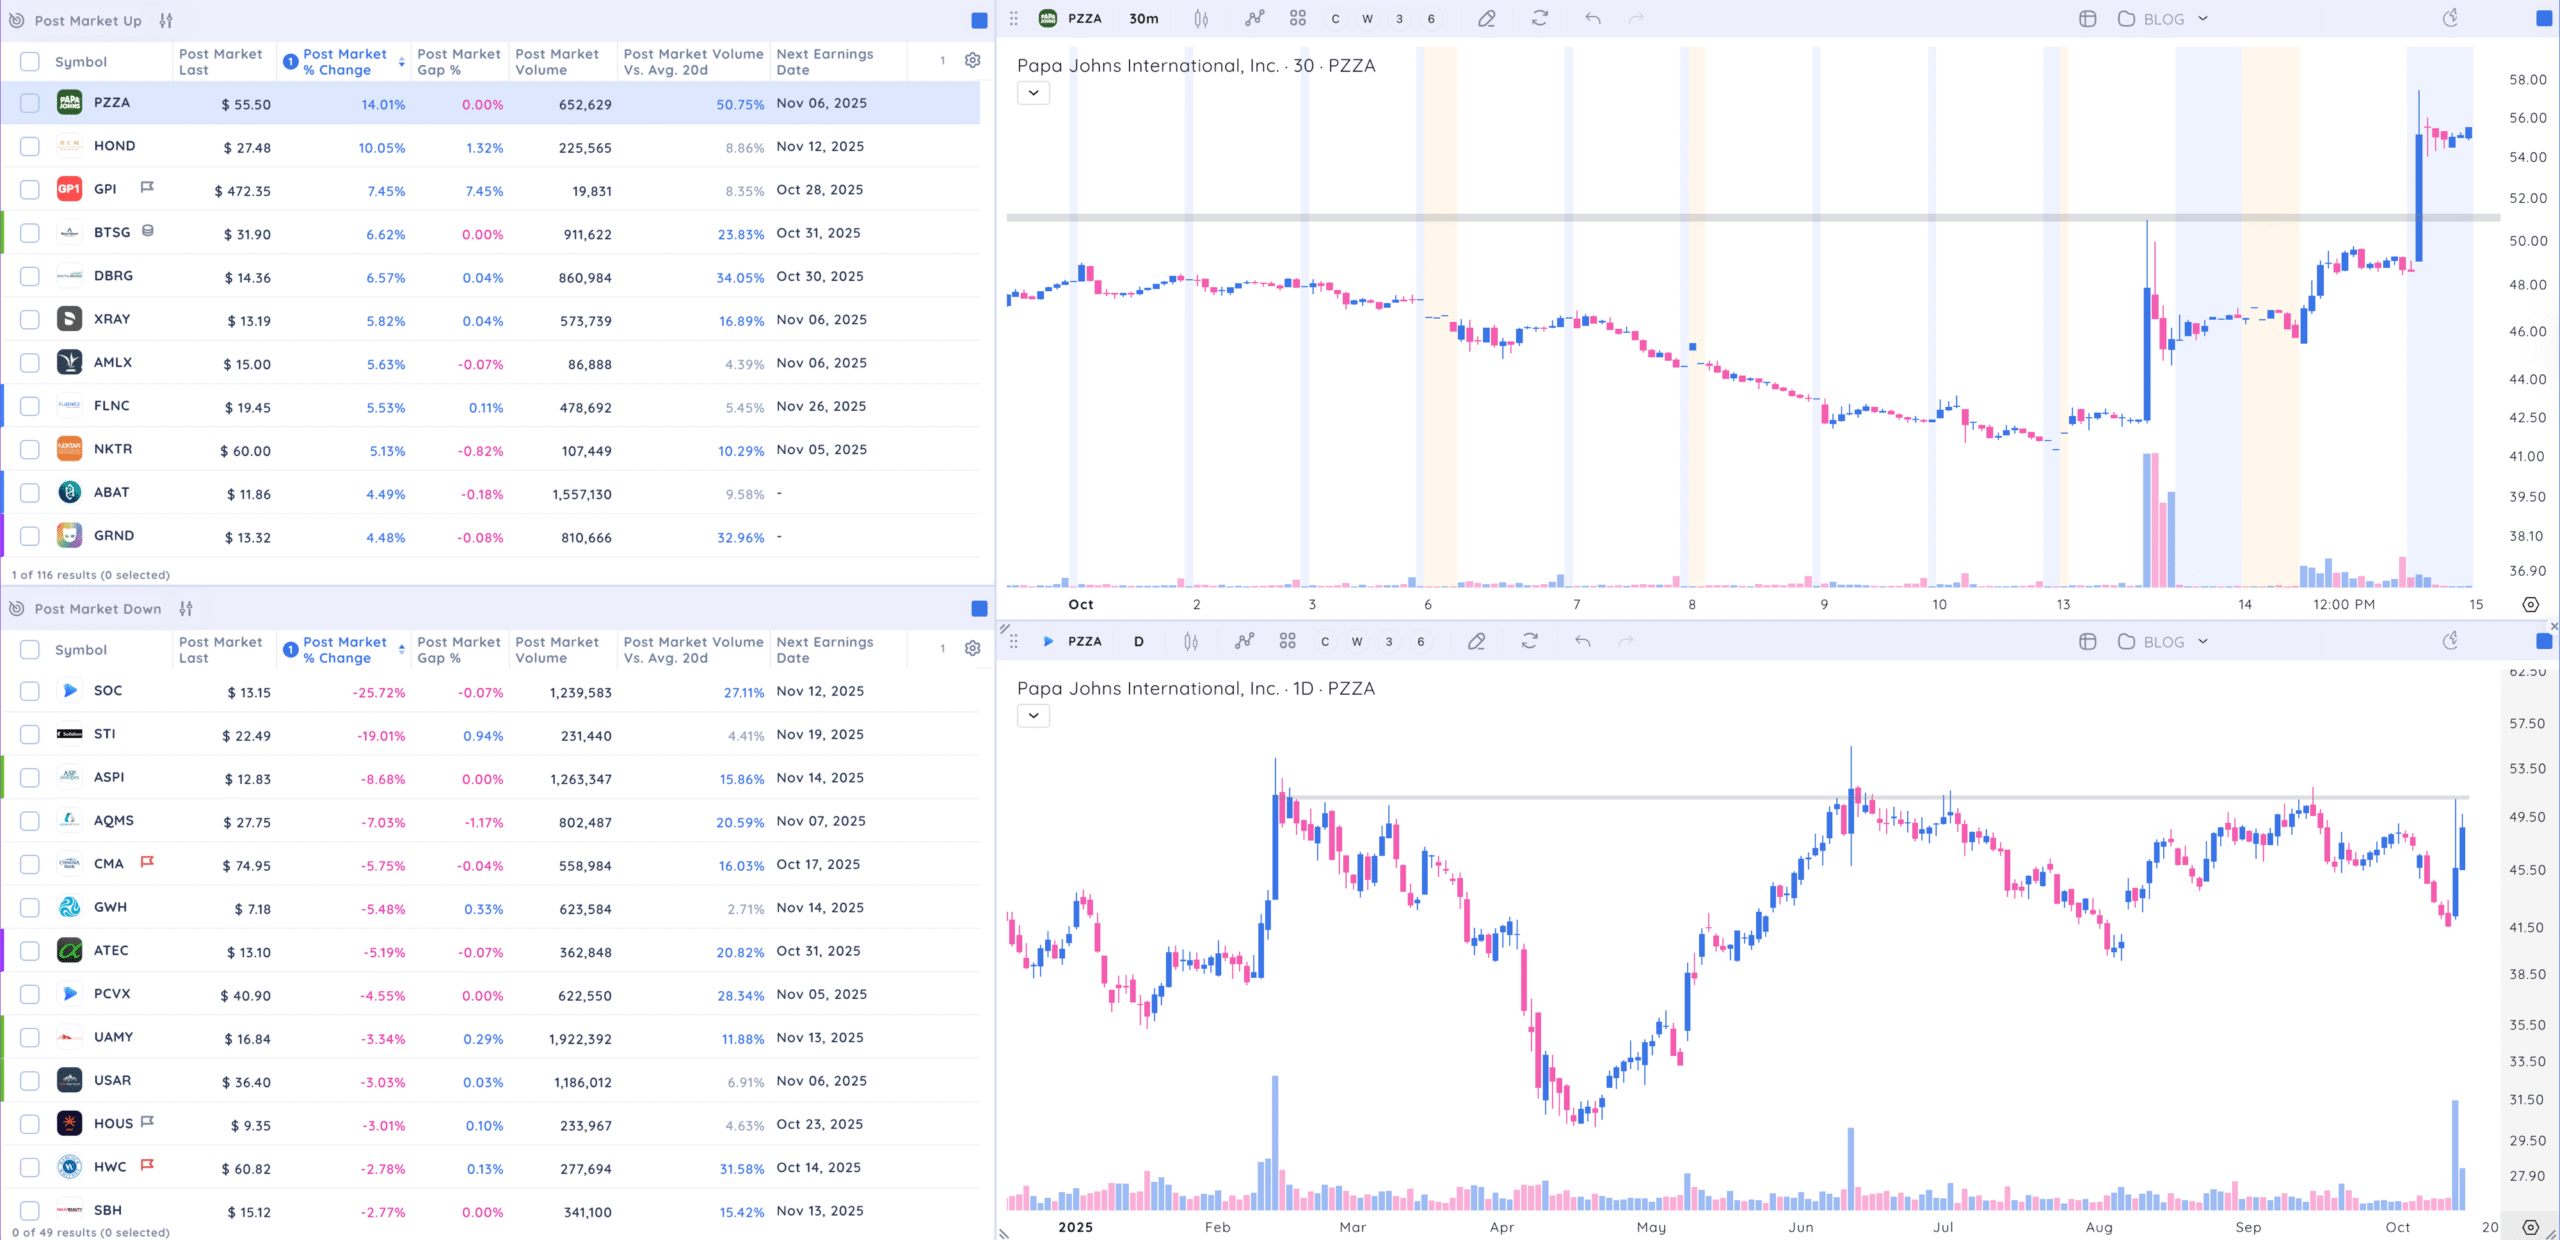
Structure your dashboard like this:
- Left side top: Gainers screener
- Left side bottom: Losers screener
- Right side top: Intraday chart
- Right side bottom: Daily chart
Save your layout as Post-Market Dashboard so you can access it quickly each evening.
Copy this layout or experiment on your own. Combine screeners, watchlists, and various timeframe charts all in one place.
Final Thoughts: How Post-market Analysis Gives You an Edge
A smart post-market dashboard helps you stay one step ahead. By tracking metrics like % change, volume, gap size, and earnings reactions, you can find high-quality setups before the next trading session even starts.
This isn’t about chasing every after-hours move. It’s about spotting the stories behind the numbers, like a stock surging on record earnings or bouncing off lows after bad news.
Big moves after the close reveal where the money’s going and what traders care about most.
Just remember: low liquidity means higher risk. So always pair your insights with smart risk management.
Mastering post-market analysis isn’t just about being prepared – it’s about gaining the confidence to act when opportunity knocks.


