Last Updated:
September 29, 2025
What is the Pre-Market and Why Track It?
Pre-market analysis might seem like it’s reserved for seasoned traders and institutions, but understanding what happens before the opening bell can give you a serious edge. By learning how to read pre-market data, set up a smart screening process, and use the right tools, you’ll be able to spot timely trading opportunities.
The pre-market is the period before regular trading hours, where investors can buy and sell stocks – typically between 7:00 a.m. and 9:30 a.m. EST. Since traditional market makers don’t start until 9:30 a.m., all trades during this session use limit orders.
This early trading window usually comes with lower liquidity, wider bid-ask spreads, and higher volatility, all thanks to fewer participants and limited volume. That might sound risky, and it can be, but with the right approach, it also opens the door to unique opportunities.
What is more important for most retail traders is not actually placing trades before the market opens, but watching to see which stocks are being actively traded. By monitoring early data, you get a pulse on how the day might unfold.
Why Track the Pre-Market?
Watching early morning movement isn’t just about curiosity – it’s about spotting early signals that can shape your game plan for the day. Here’s what you can uncover:
See where money’s flowing early: Pre-market activity can show you which stocks or sectors are getting attention, often driven by overnight news like earnings reports, geopolitical events, or moves in overseas markets. For example, a stock jumping after a strong earnings report might suggest strong demand at the open.
Identify trade setups ahead of time: Big moves or volume spikes before the market opens can point to momentum or reversal plays, giving you time to plan your strategy before the chaos of the regular session kicks in.
Gauge market direction: Watching broad ETFs like SPY (which tracks the S&P 500) before the market opens, alongside futures, can help you get a sense of whether the overall market is likely to open bullish or bearish.
Track key stocks and ETFs: Heavily traded names often react to news overnight. Watching this early action can give you a preview of how the regular session might unfold.
Catch early entry or exit points: For experienced traders, trading before the market opens can provide great entry or exit spots. Just be aware that with low liquidity, you’re also taking on more risk.
Understand the risks: Early morning moves don’t always stick. The low volume can lead to false signals or quick reversals once the regular session kicks in. Knowing this helps you approach early trading with the caution it deserves.
How to Screen the Pre-Market
Not all pre-market moves are meaningful. That’s why screening is critical – it filters the noise and helps you focus on what matters.
Key Metrics to Watch in the Pre-Market
Here are the top data points you’ll want to track each morning:
- Pre-market % change: This shows how much a stock’s price has moved since the previous day’s close. Look for moves of ±2% or more – they often indicate meaningful catalysts and potentially powerful moves.
- Gap up/down: A gap up means a stock is trading above yesterday’s close, while a gap down means it’s below. Gaps tied to news, like earnings surprises, can point to strong sentiment and form an Episodic Pivot that continues into new all-time highs.
- Pre-market volume: This tells you how many shares have traded before the market opens. Higher volume signals more conviction behind a move. Just remember, even the busiest pre-market volumes are still lower than regular trading hours.
- Volume vs. 20-day average: Compare current pre-market volume to the stock’s average daily volume over the past 20 sessions. If a stock trades 50,000 shares before the market opens and its 20-day average is 1 million, that’s 5% – a very useful indicator of unusual early interest. Anything above 10% is worth a closer look.
Screening Tips for Better Results
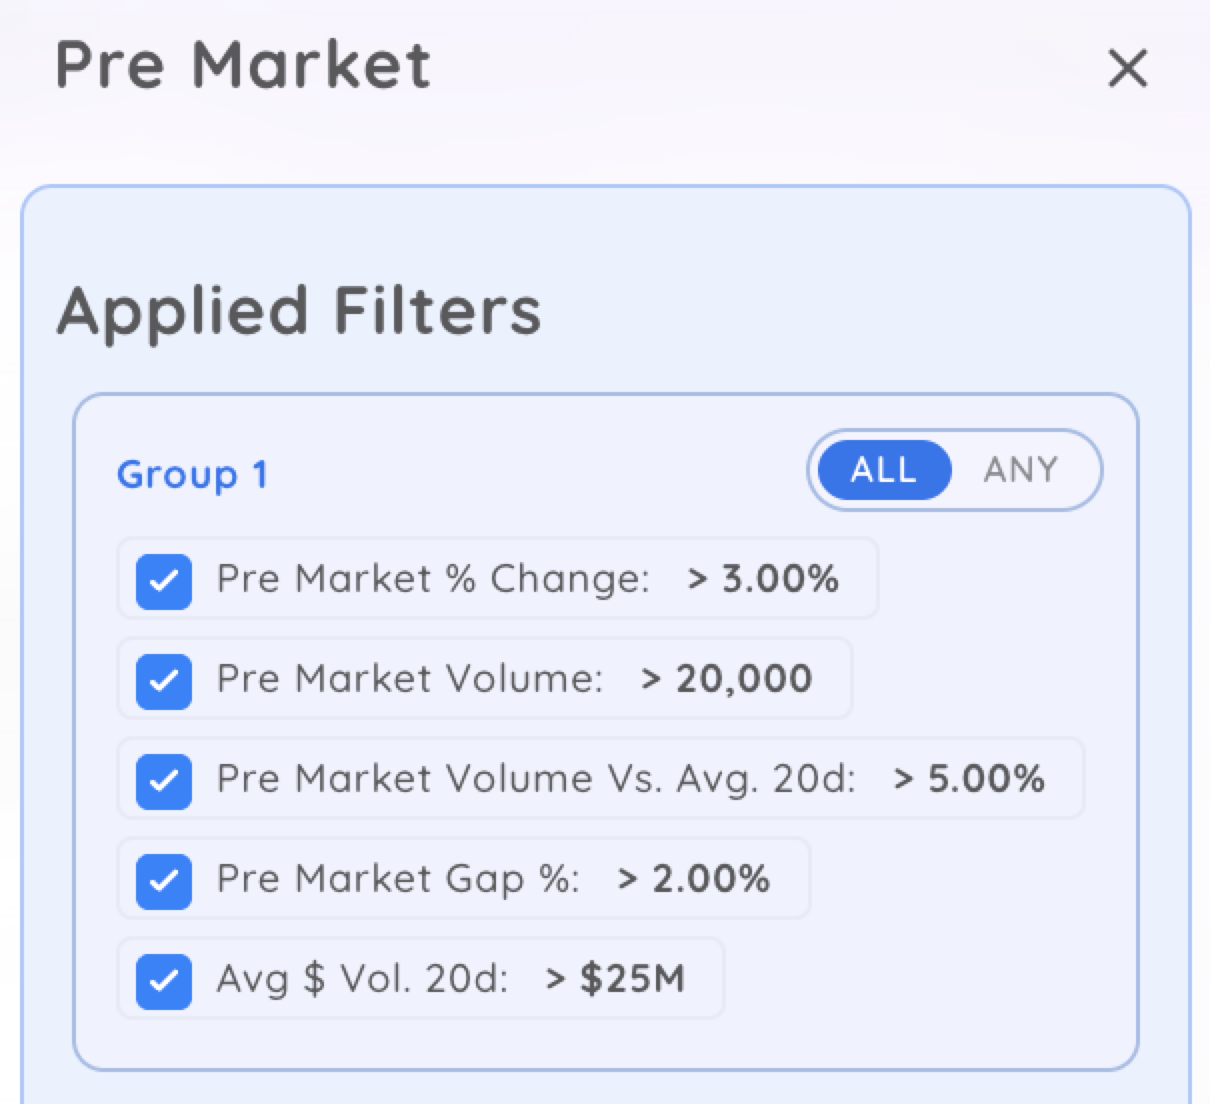
To make screening efficient, this Deepvue Screen.
- Pre-market % change greater than +3% or less than -3%
- Pre-market volume above 20,000 shares
- Volume vs. 20-day average above 5%
- Gap size more than 2%
These filters help surface the most active and potentially tradable names before the bell rings.

Create a screen for stocks that are up and stocks that are down. Use these screens later when setting up a quick dashboard to see all pre-market activity.
How to Set Up a Column Set for Pre-Market Data
You’ll save a ton of time and mental bandwidth by building a specific column layout in your trading platform. Here’s what to include:
Must-Have Data Points in Your Column Set
- Pre-market % change: Tells you how much a stock has moved since the previous close. Great for spotting early momentum.
- Gap up/down: Shows the percentage, or price difference, between the prior close and the current pre-market price.
- Pre-market volume: Helps you gauge the strength and reliability of a move.
- Volume vs. 20-day average: Reveals whether the current volume is truly significant.
- Last price: Shows the most recent trade price in the pre-market session.
Deepvue lets you customize and save watchlists with these columns. Once set, you can sort by pre-market % change or volume to quickly identify top movers.
How to Set Up a Deepvue Dashboard for Pre-Market Analysis
Setting up a Deepvue dashboard takes just a few steps, and it’ll make your morning prep way more efficient.
- Create a screener for pre-market gainers
- Pre-market % change > +3%
- Pre-market volume > 10,000 shares
- Volume vs. 20-day average > 5%
- Save this screener as “Pre-Market Gainers” for quick access each morning.
- Build a screener for pre-market losers
- Pre-market % change < -3%
- Pre-market volume > 10,000 shares
- Volume vs. 20-day average > 5%
- Save it as “Pre-Market Losers” to track downside movers with potential trade setups.
- Add and organize column sets for consistency
- Use the same column set we covered earlier and apply it to both your gainers and losers screeners. This makes comparison quick and smooth.
- Use charts to visualize pre-market activity
- Intraday chart with extended hours: Use a 5-minute or 30-minute chart with extended trading enabled. This helps you spot patterns like breakouts or reversals forming in real time.
- Daily chart: Add a daily timeframe to give context. You’ll want to know if a gap is happening near support, resistance, or in the middle of a trend.
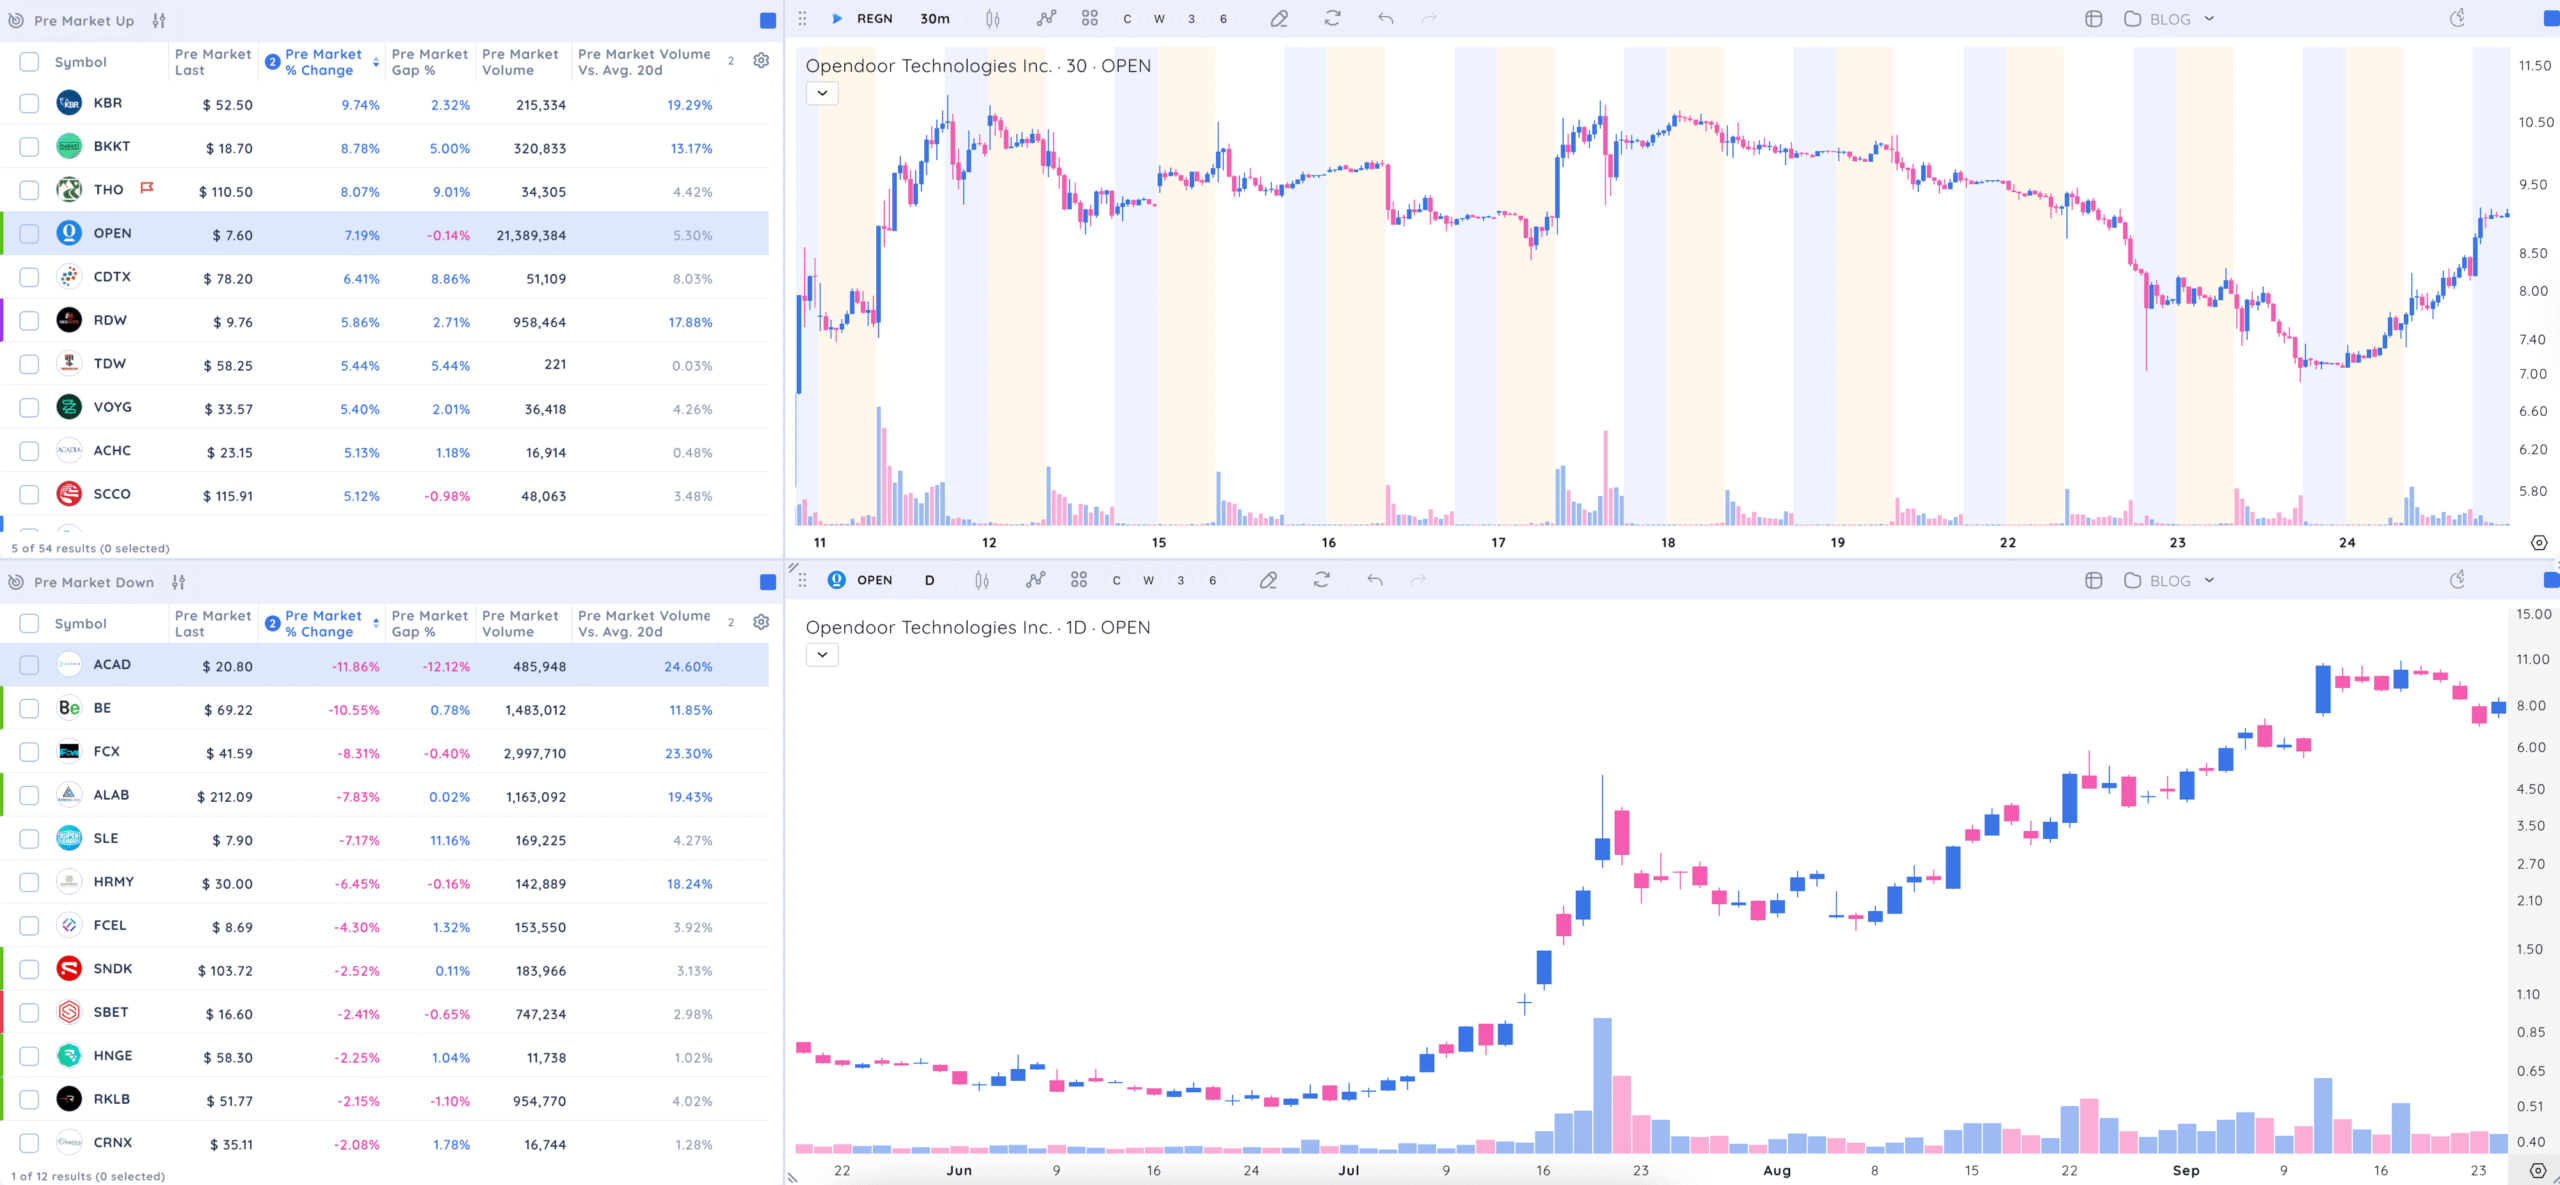
Structure your dashboard like this:
- Left side top: Gainers screener
- Left side bottom: Losers screener
- Right side top: Intraday chart
- Right side bottom: Daily chart
Save this setup as “Pre-Market Dashboard” so it’s ready every morning.
Copy this layout or experiment on your own. Combine screeners, watchlists, and various timeframe charts all in one place.
Why Watching the Pre-Market Gives Traders an Edge
Pre-market action isn’t just noise – it’s an early action system. It shows you where money is moving, highlights high-probability setups, and gives you a head start on the rest of the market.
By tracking key metrics like % change, gap size, and volume, and organizing your tools with a clear dashboard setup, you’ll be ready to act with confidence when the bell rings.
Just remember: trading before the market opens comes with extra risk. The lack of liquidity can cause sudden moves that don’t always hold into the regular session. That’s why it’s crucial to combine data analysis with experience and caution.
Mastering pre-market analysis gives you a serious edge, and it can set the tone for a more successful trading day, every day.


