Last Updated:
August 7, 2025
Who is Mike Webster
Mike Webster is a veteran stock trader and portfolio manager with decades of experience in the financial markets. He’s best known for his deep roots in CANSLIM, a growth-focused investing strategy developed by William O’Neil.
Over the years, Webster has become a leading voice in technical analysis and market strategy, where he shares his knowledge through IBD Live and educational videos. Traders and investors alike trust him for his insight and real-world experience.
Mike Webster is a technical swing trader who leans into growth and momentum trading. He looks for stocks with strong earnings, new products or services, and powerful chart patterns.
Instead of gut feelings, he relies on backtesting and historical trends to find the best times to buy or sell. His research shows his dedication to building systems that cut out emotion and boost consistency.
Mike Webster Indicators: What makes them unique?
In the trading world, Mike Webster is known for creating practical, easy-to-use indicators that help traders analyze the market and leading stocks. These tools help traders stay in sync with market cycles, uncover strength, and manage risk more effectively.
Mike Webster, also known to many as “Webby,” is a trusted strategist who’s changed how traders look at the market. His indicators are now core tools for traders who want to ride trends and avoid traps.
His clear, down-to-earth style makes complex ideas easy to grasp, even for beginners. Webster’s data-driven tools have helped him call big market moves, like the 2020 Covid bottom and “power trends” in 2023 and 2025.
What is the Webby RSI and how does it work?
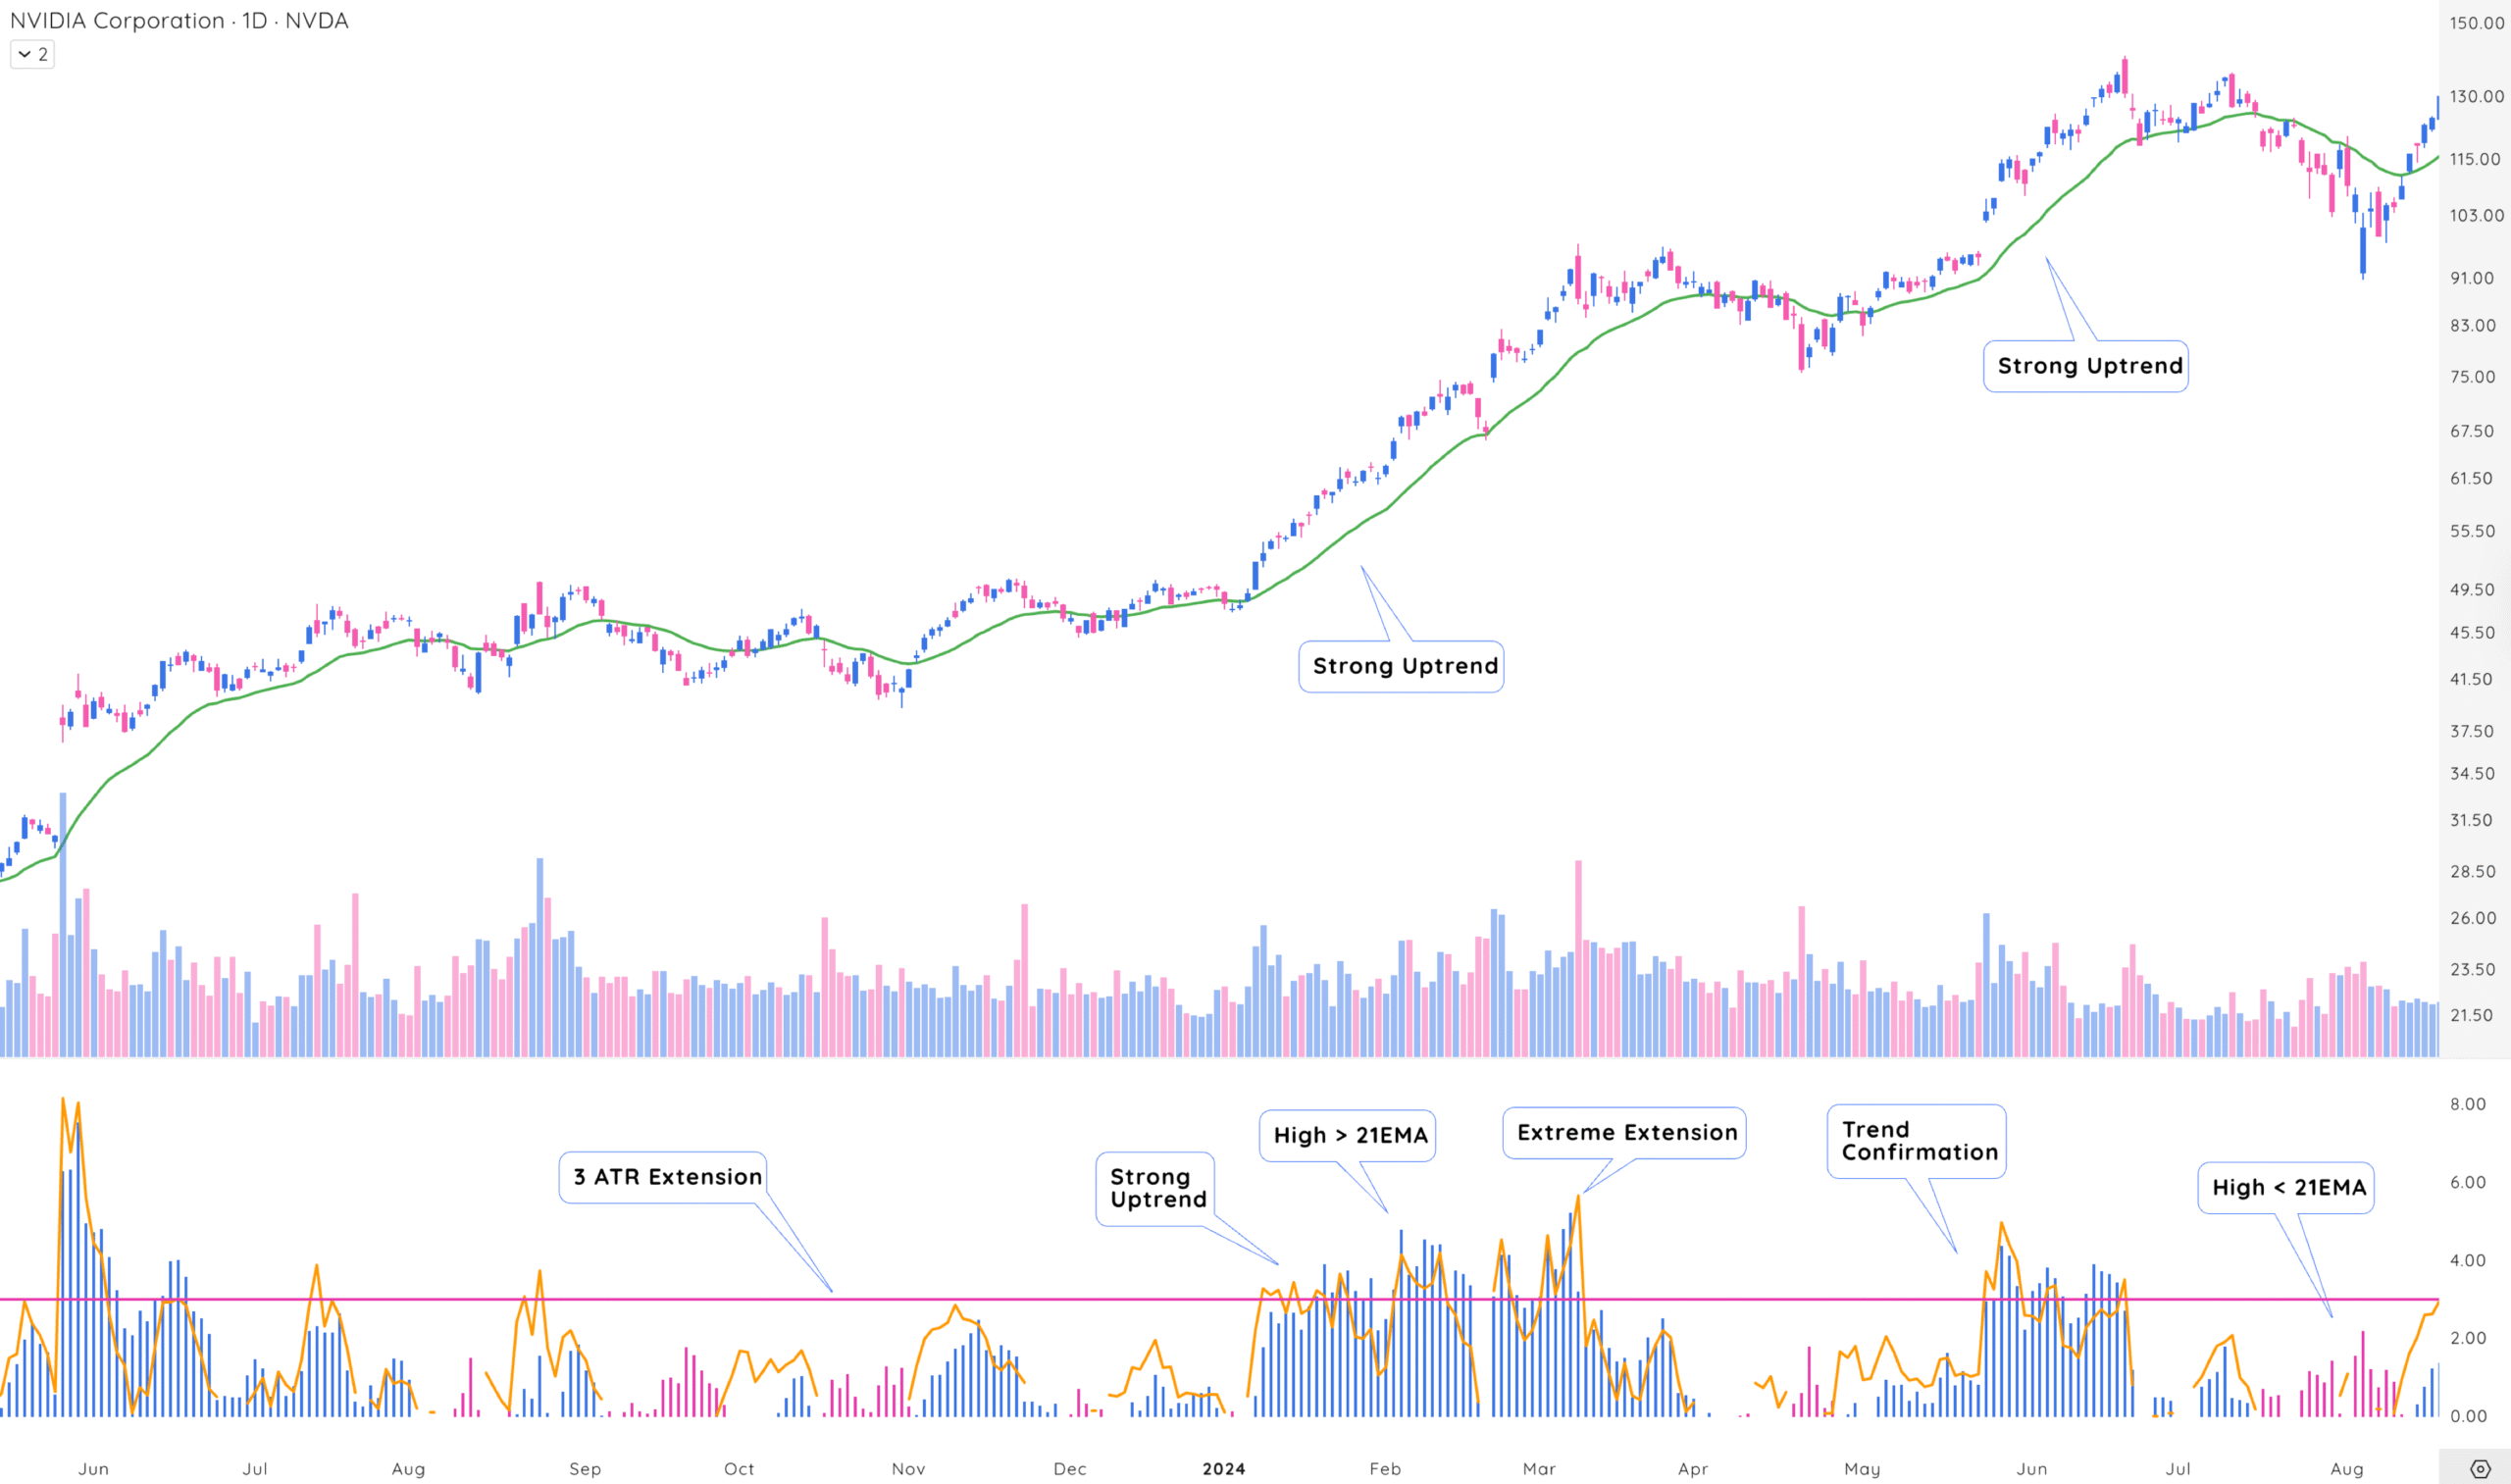
The Webby RSI, short for Really Simple Indicator, is a momentum tool created by Mike Webster to gauge the strength of a stock’s uptrend, especially in major indexes like the Nasdaq Composite, or fast-moving growth stocks. It’s different from the traditional RSI (Relative Strength Index), which compares gains to losses.
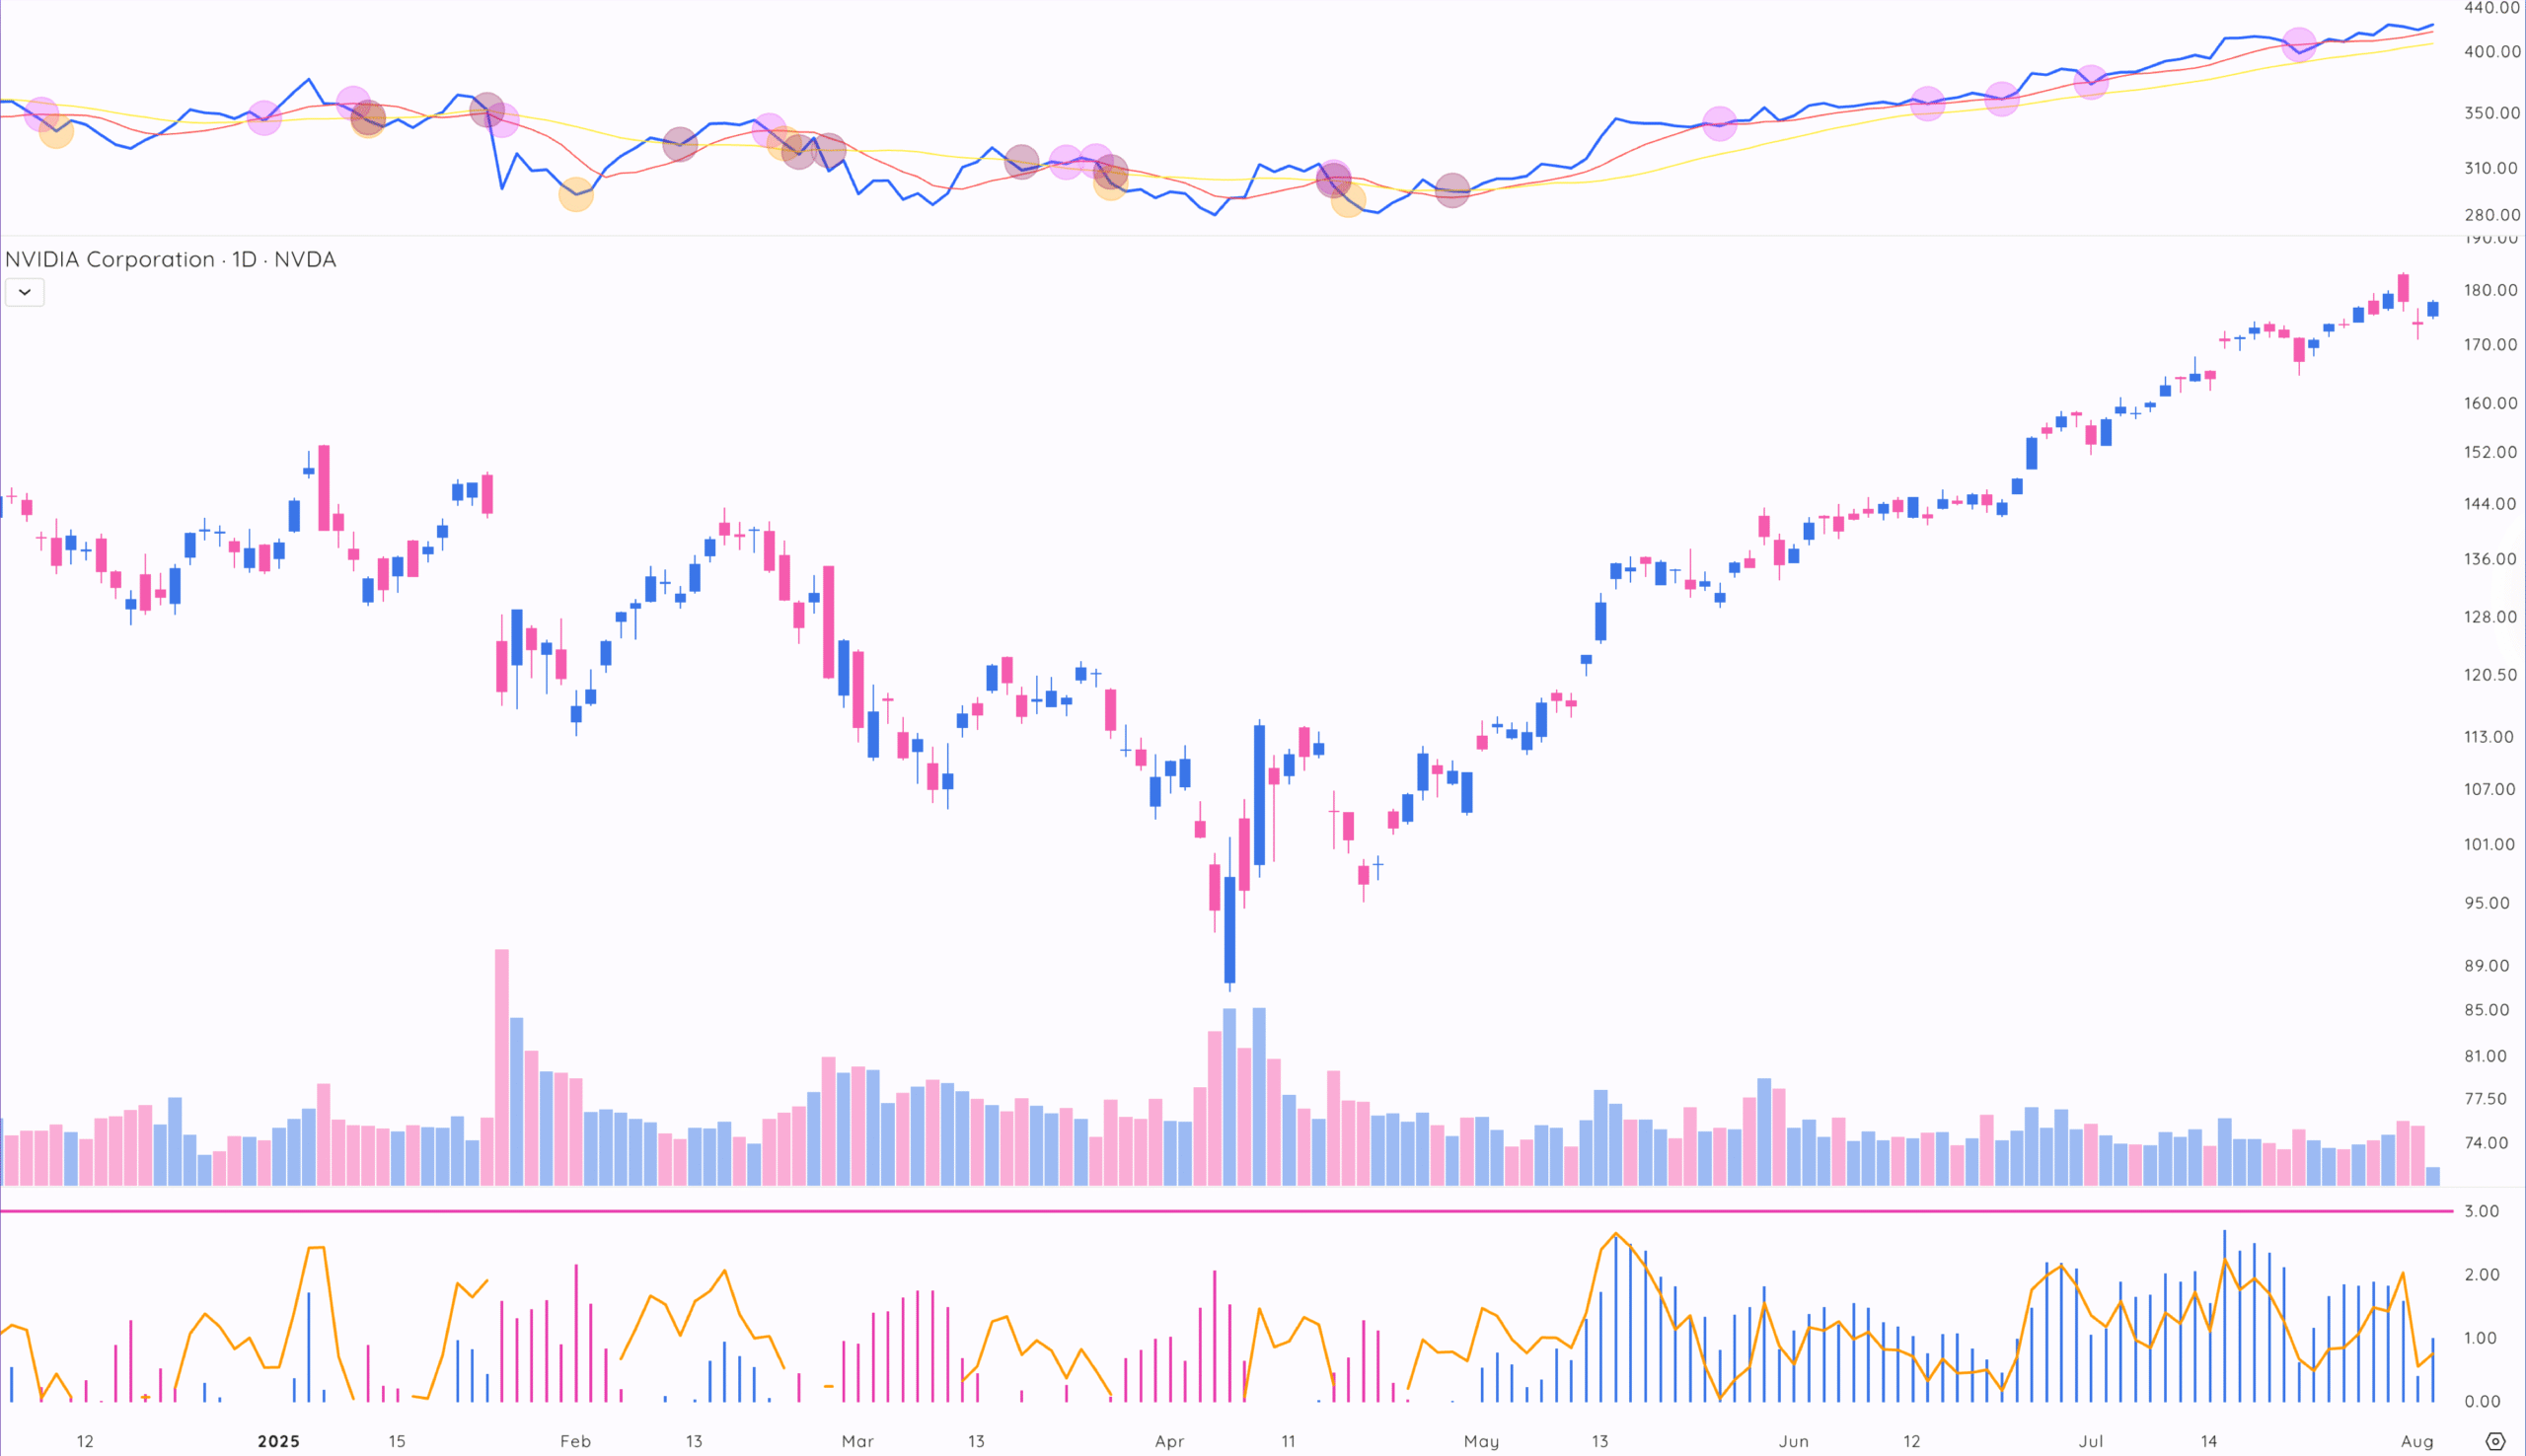
The Webby RSI looks at how far a stock is from its 21-day exponential moving average (EMA), measured as a percentage in Average True Range (ATR).
- In an uptrend, it measures the distance between the low and the 21-day EMA.
- In a downtrend, it measures the distance between the high and the 21-day EMA.
This allows traders to easily track uptrends, potential reversals, and oversold (or overbought) conditions.
In addition, the Webby RSI also includes a measurement (also in ATR) displaying how far the stock’s high is above the 10-day simple moving average (SMA) plotted separately as a line.
How to interpret the Webby RSI
Positive RSI (blue histogram)
- Plots when the low is above the 21-day EMA
- Values below 3 ATR units = trend is healthy
- Values above 3 ATR units = trend may be overextended (caution zone)
Negative RSI (pink histogram)
- Plots when the high is below the 21-day EMA
- Larger negative values = deeper pullbacks or possible oversold setups
- Useful for spotting bearish momentum or possible trend reversals
10-day SMA extension (yellow line)
- High values here = short-term overextension
- Often a good profit-taking signal, especially in sharp uptrends
What are Mike Webster’s Quick, Quicksand, and Grateful Dead signals
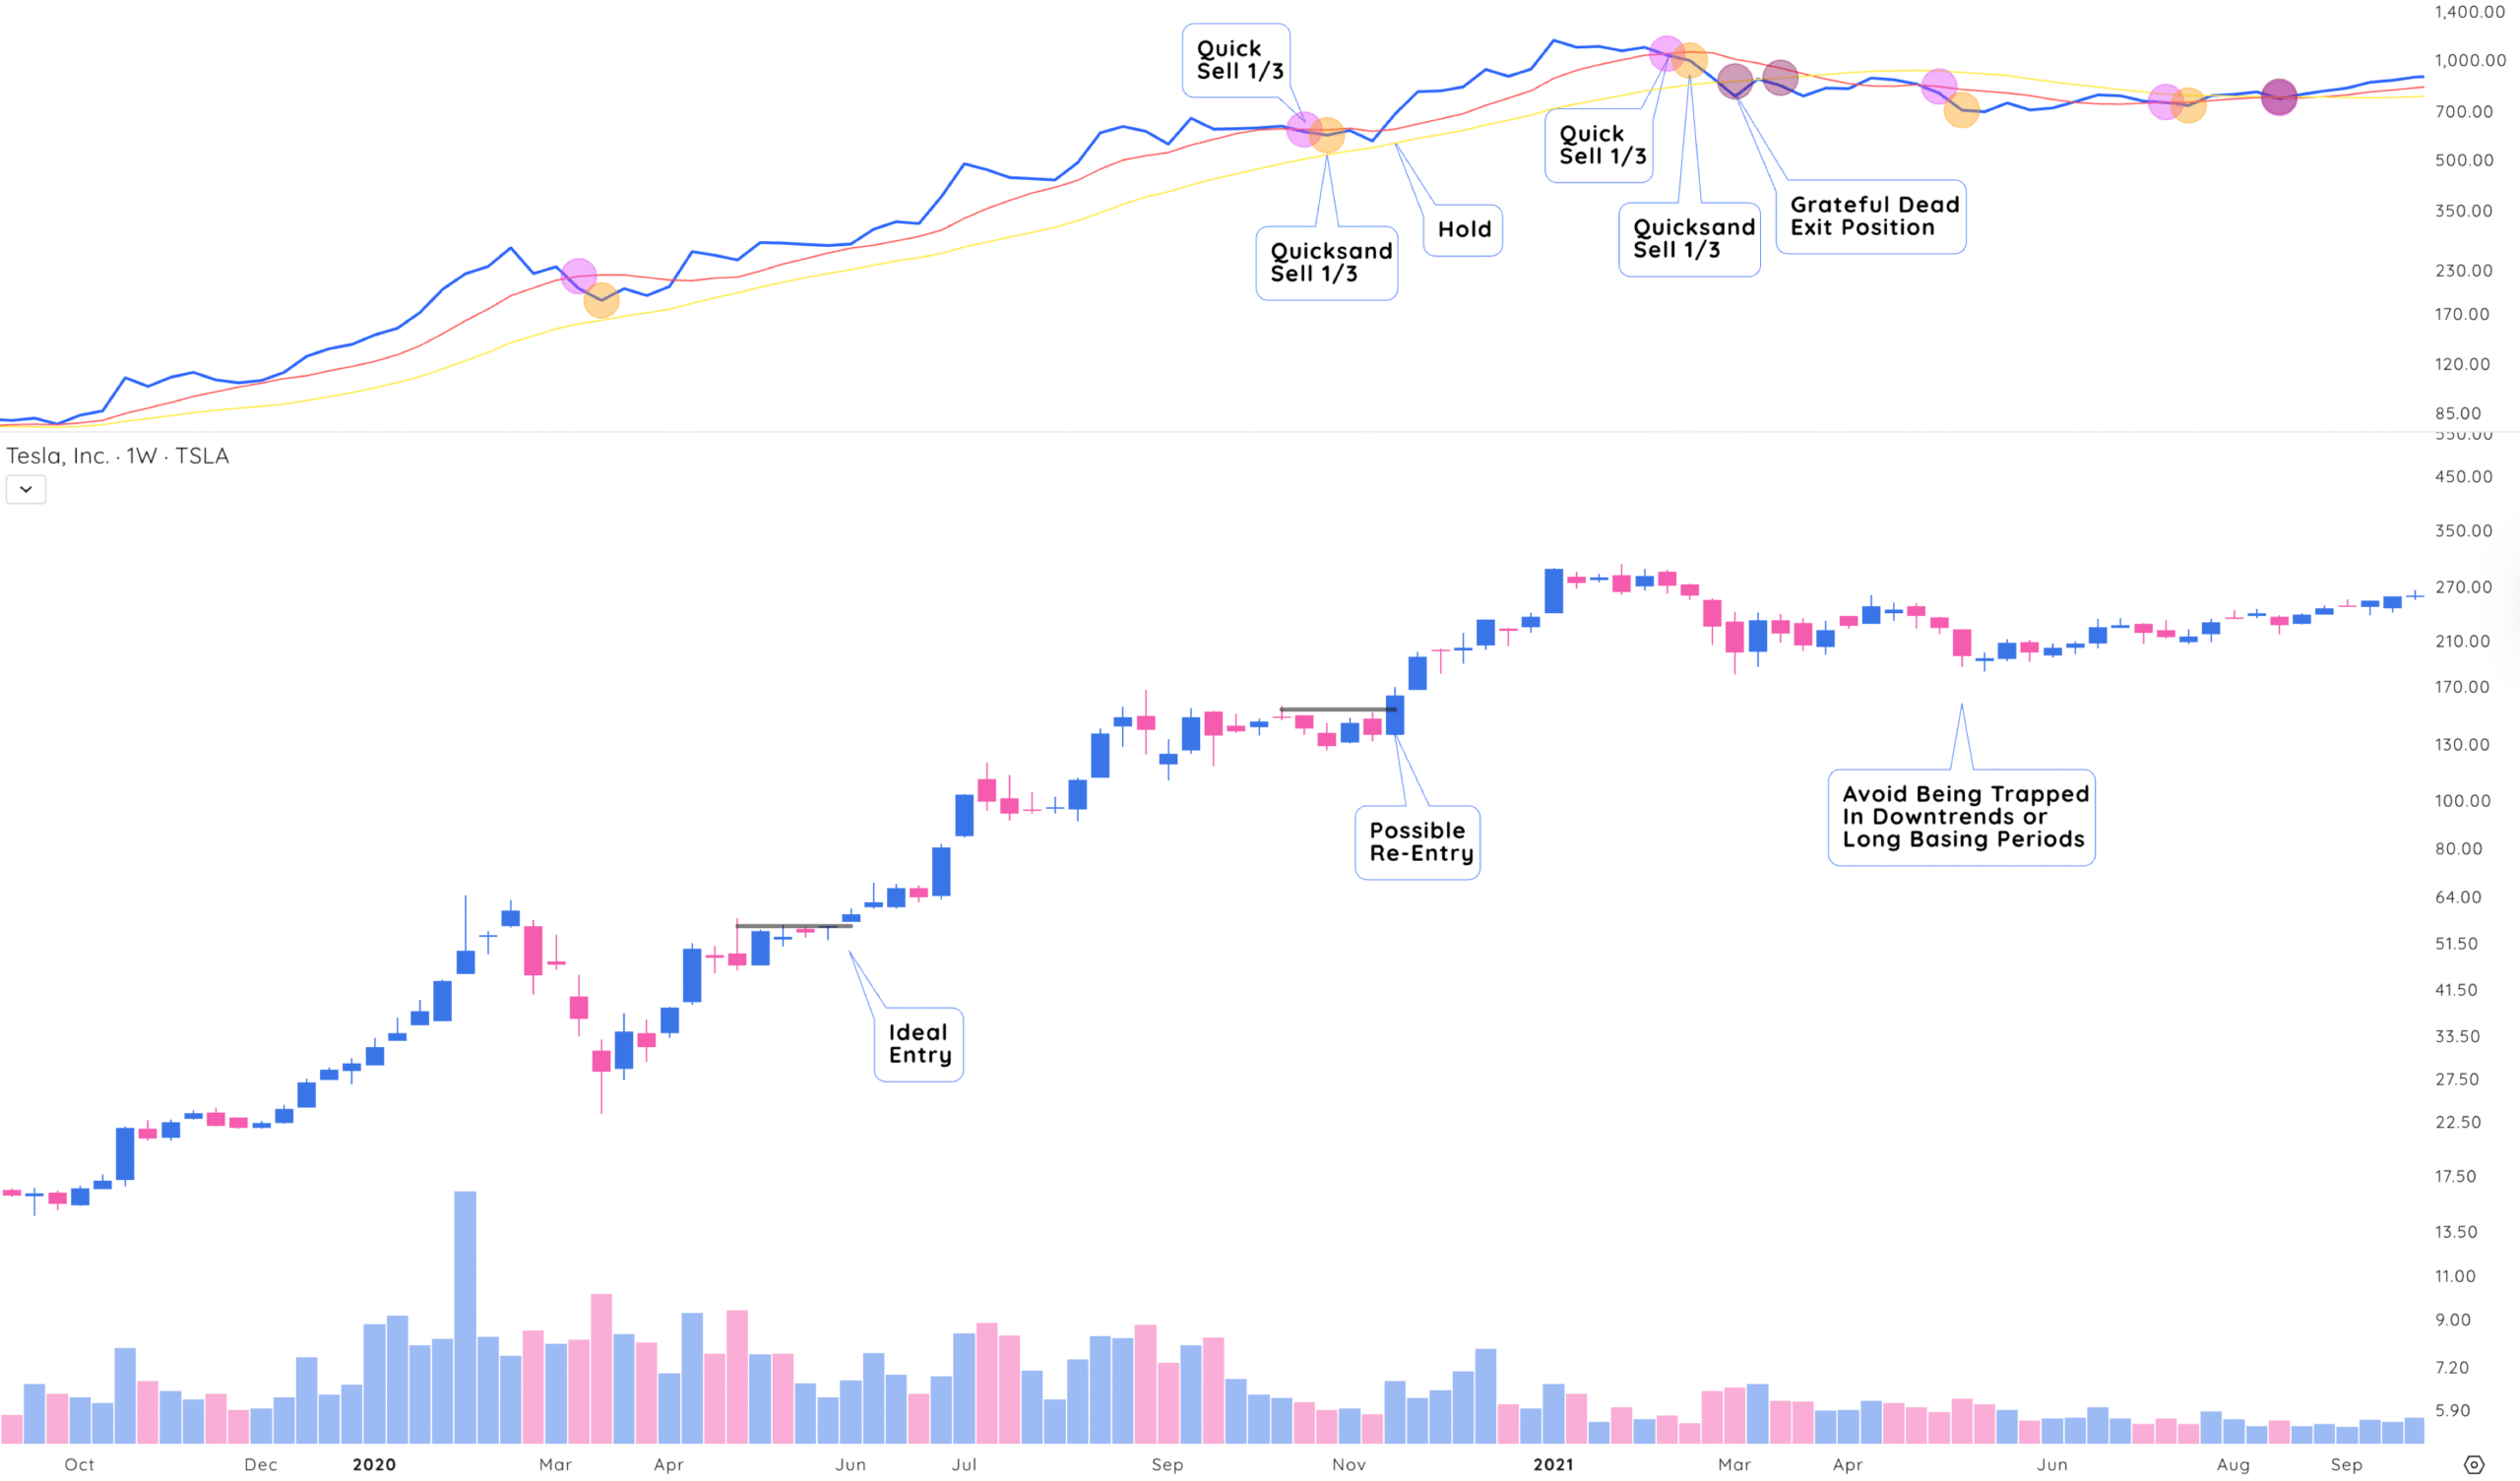
The Quick, Quicksand, and Grateful Dead system is designed to help you hold onto your winners. This method is strictly for trades where you’re already in profit, and it gives you a systematic way to manage the core part of a winning position without second-guessing yourself.
The idea is simple: as a stock starts to weaken, you scale out in stages using clear signals based on the relative strength (RS) line and moving averages.
To fully interpret the Quick, Quicksand, and Grateful Dead signal, you need to add the 8-day and 21-day SMA to your weekly RS line. After your position is showing long-term profits, try to hold on as long as possible.
As the RS Line weakens, you gradually trim your position size.
How to interpret Mike Webster’s Quick, Quicksand, and Grateful Dead signals
Only use it when you’re in profit – Don’t wait for these signals if you’re already down.
Once you’re up 10% or more, apply these rules to your core 15% position:
- Quick: RS line crosses below the first moving average → sell 5%
- Quicksand: RS line drops further → sell another 5%
- Grateful Dead: RS line breaks the longest moving average → sell final 5%
You can adjust the percentages. For example, if you’re having a great year, you might leave more in. If the year’s been rough, you may trim earlier and more aggressively.
These aren’t hard rules. Webster emphasizes that even Bill O’Neil changed his strategies over time. Adapt them to what works best for you.
What is the % off 52-week high indicator and how do you use it?
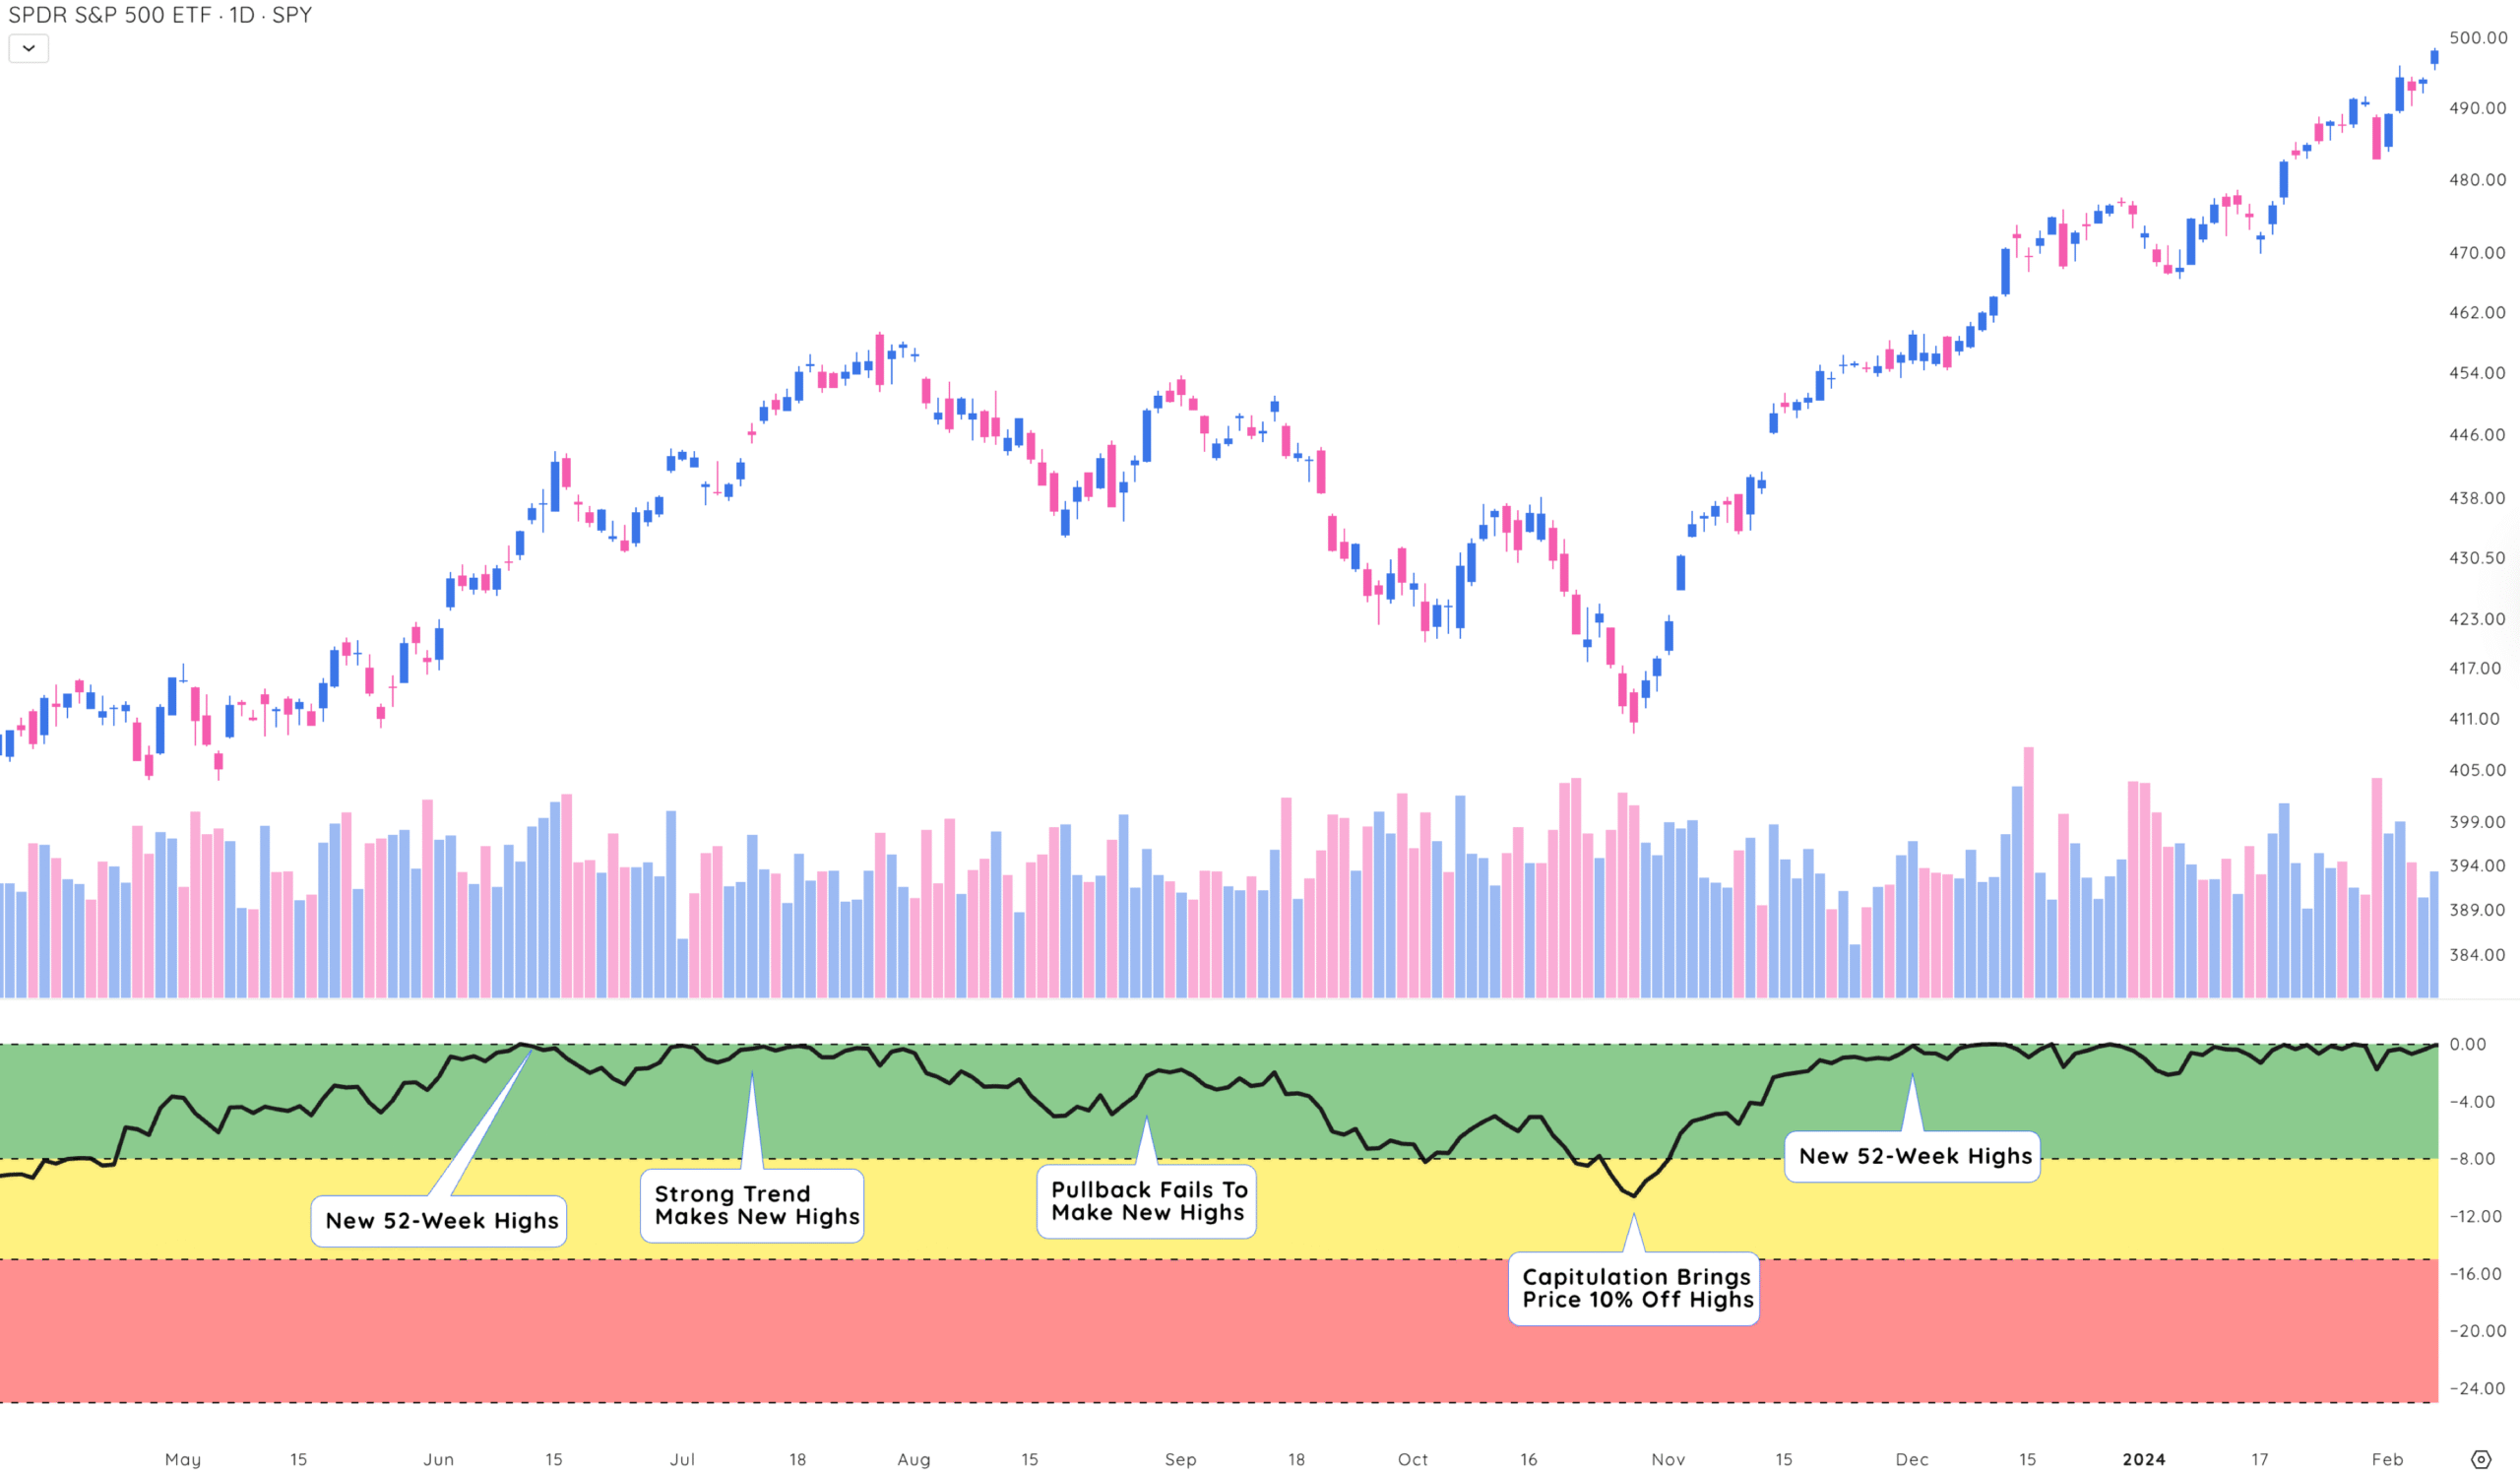
The % Off 52-Week High indicator is a simple but powerful tool that helps you quickly see how far a stock has pulled back from its highest price in the past year. It gives you a percentage that tells you how far the stock has dropped from its peak.
A stock that’s 5–10% off its high may just be going through a normal consolidation phase, especially in a strong uptrend. But when a stock is 30–40% off its high, it often signals a deeper correction or a breakdown in leadership.
If a stock has spent time consolidating and is now approaching its 52-week high, that can be a sign it’s ready to break out. Stocks within 10% of their 52-week highs are often watched closely by momentum traders as breakout candidates.
Mike Webster also uses this indicator on major indexes like the Nasdaq Composite to get a sense of where the market stands.
- In a strong bull market, leading stocks and indexes hover near their highs (within 5–10%).
- During corrections or bear markets, they can sink 20–50% or more from their highs.
Tracking the average % Off 52-Week High across top stocks gives you a temperature check on market conditions.
How to use the % off 52-week high indicator
Webster uses the % Off 52-Week High as one of several tools in his technical analysis toolbox to stay in sync with market cycles. It helps answer critical questions like:
- Is the market offering strong setups or is it time to stay defensive?
- Is this pullback normal or a warning?
- Is the stock still a leader?
When paired with other tools, like the Webby RSI or RS moving average signals, the % Off 52-Week High provides extra confirmation to either stay in a trade or step aside.
Adding Mike Webster indicators to your charts
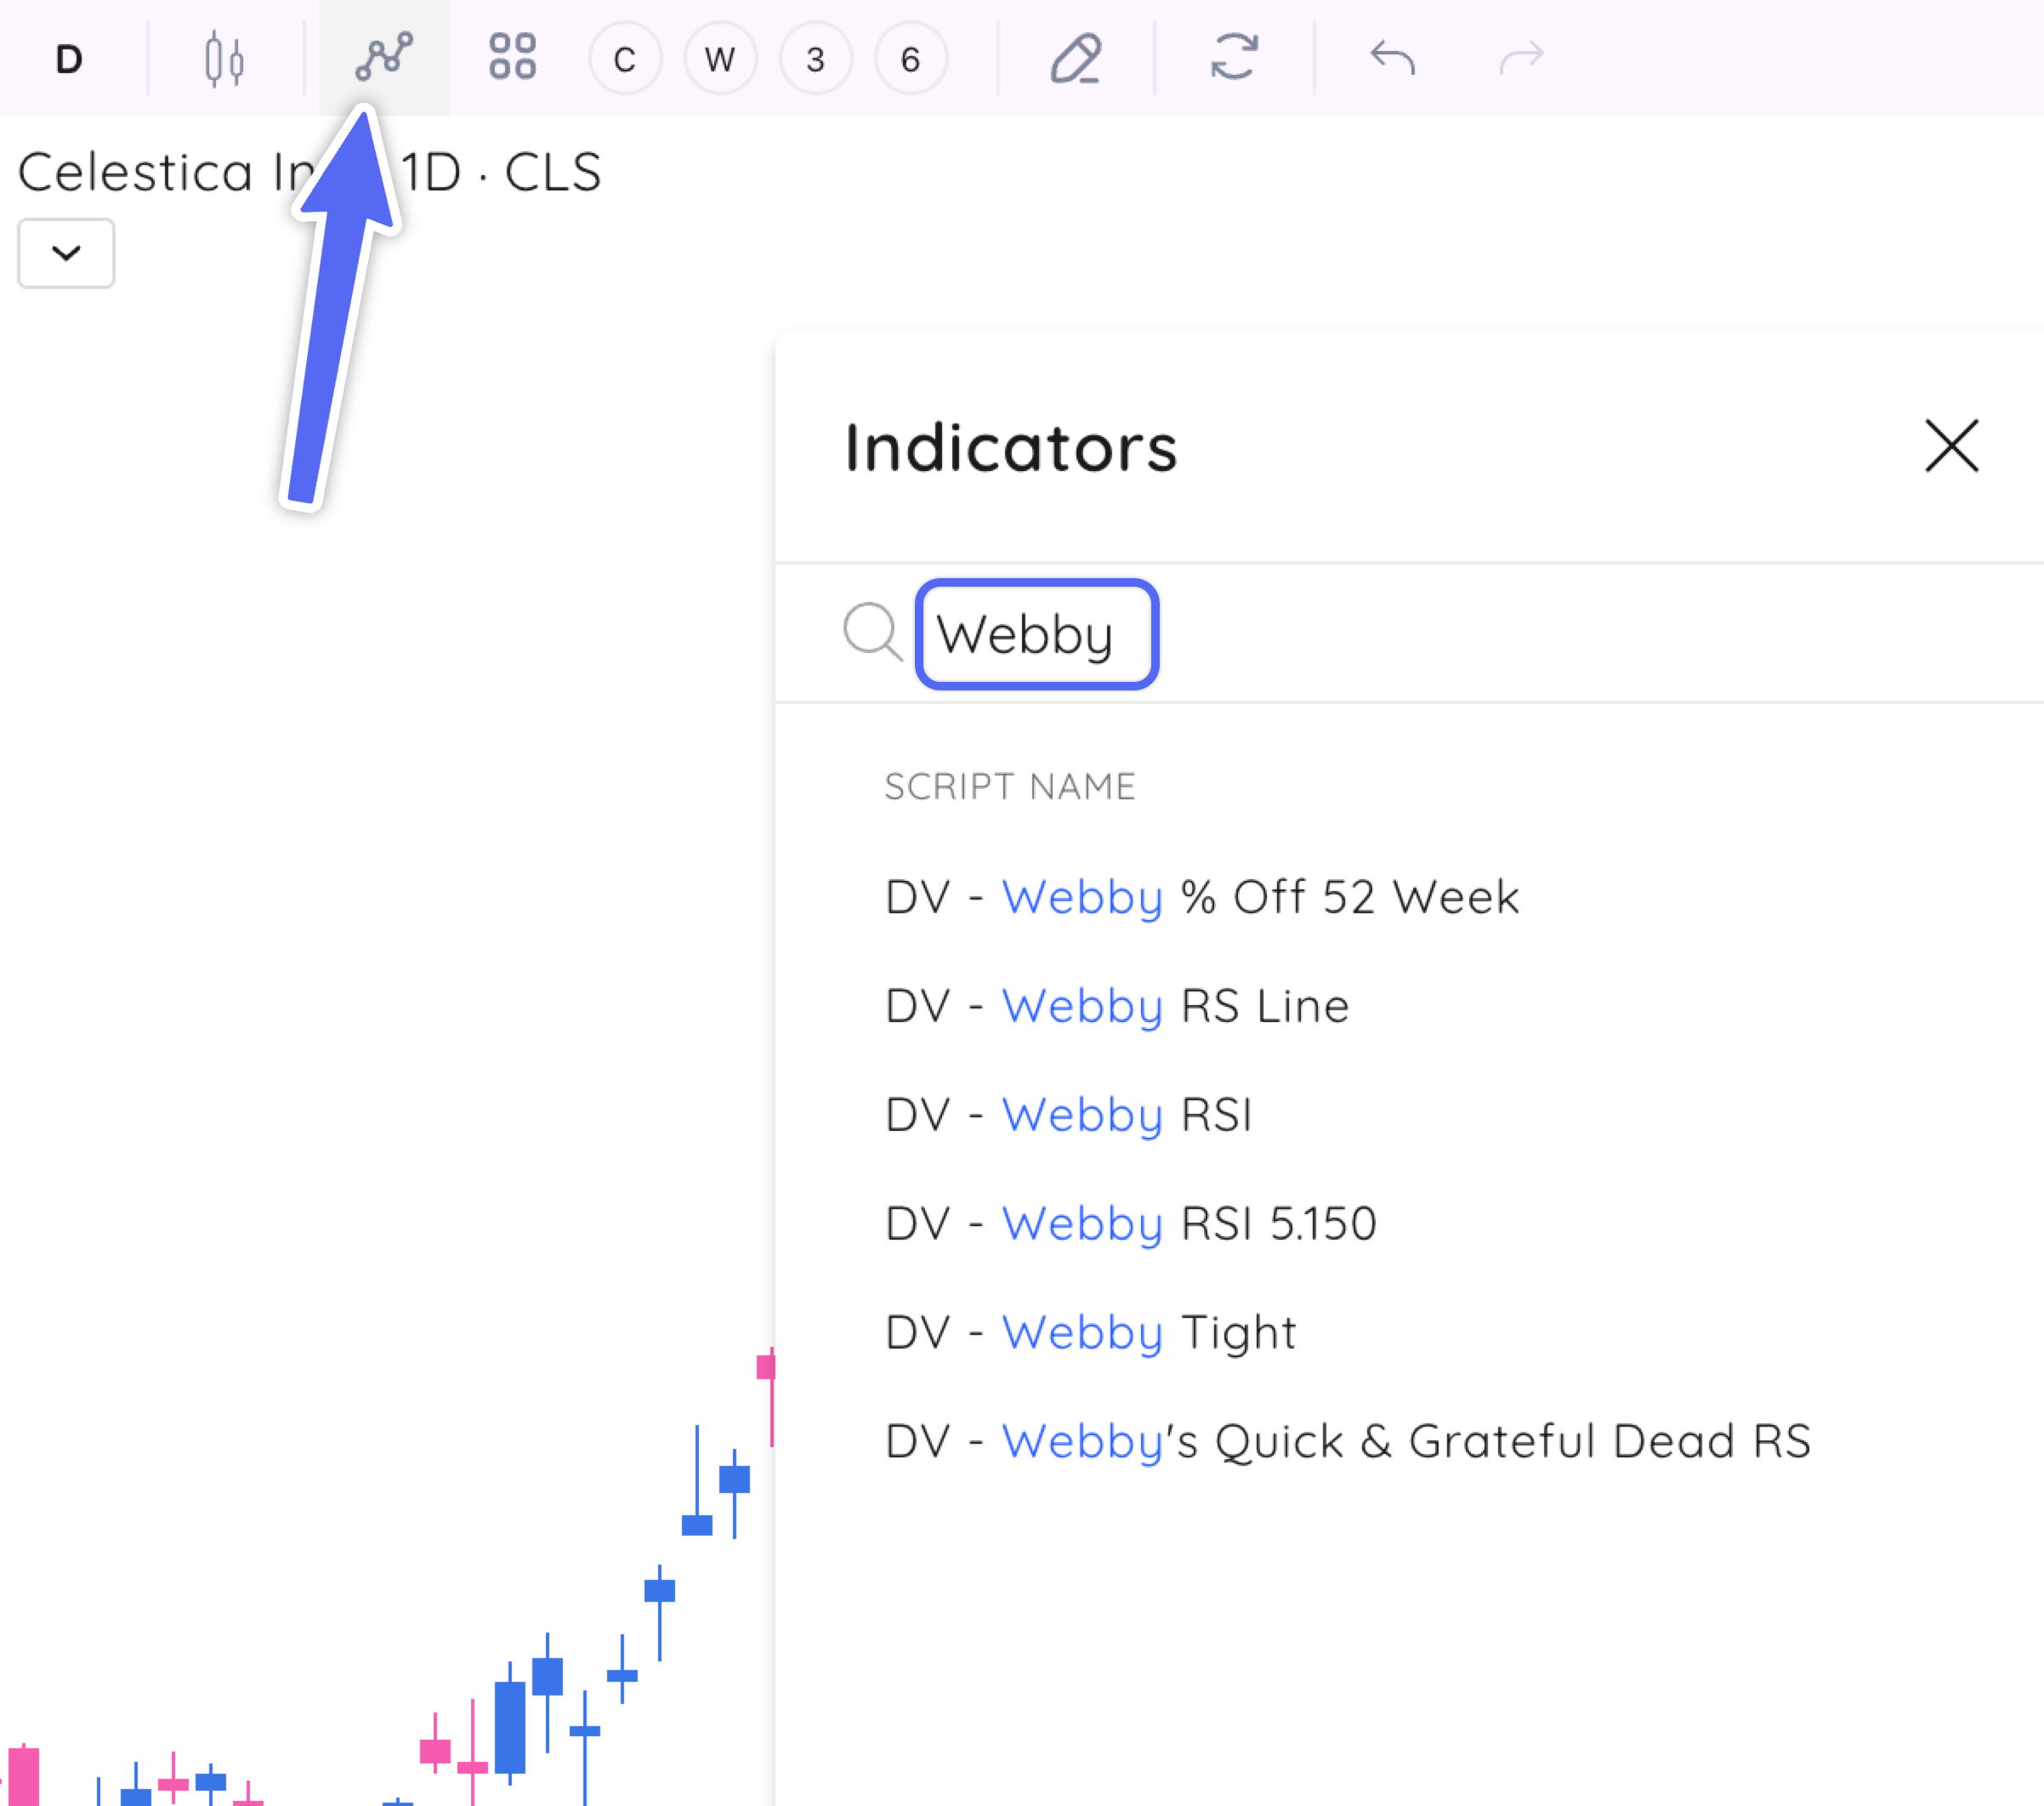
Getting started is easy. Open your chart and go to the Indicators & Strategies menu and search for “Webby.”
For each indicator, you can personalize the coloring to match your own charting style.
💡 Pro Tip: Combine multiple Mike Webster Indicators to see what he is looking at.
Using Mike Webster Indicators
Mike Webster isn’t just sharing theories – he’s giving you a proven system shaped by decades of trading experience. His indicators are built for real-world use, helping you spot trends, manage risk, and stay grounded when emotions run high.
Tools like the Webby RSI, Quick/Quicksand/Grateful Dead signals, and the % Off 52-Week High indicator simplify what most traders overcomplicate. They’re visual, straightforward, and designed to keep you in sync with the market, not fighting it.
What makes Mike’s approach stand out is how practical it is. These are tools that he uses to navigate actual trades, time entries and exits, and hold through tough pullbacks.
If you want to trade with more clarity and consistency, his indicators are a great place to start. They won’t replace your own judgment, but they’ll give you a solid framework to make better, faster decisions.
Try them out. Customize them. Make them your own. That’s what Webster’s is all about -giving traders the tools to think for themselves and stay one step ahead.


