What Is the Force Index?
The Force Index is a technical indicator that quantifies market power using price and volume. Created by Dr. Alexander Elder, it’s one of the few tools that doesn’t just tell you what happened—but hints at who’s winning: bulls or bears.
It calculates the “force” behind a price move by multiplying price change by volume. Simple math, surprisingly useful.
If price moves up on high volume, that’s bullish force. If price drops on big volume, bears are in control. If price barely moves and volume fades, momentum’s dead. That’s your signal to stop forcing trades.
How the Force Index Works
The basic formula:
Force Index (EFI) = (Today’s Close – Yesterday’s Close) × Today’s Volume
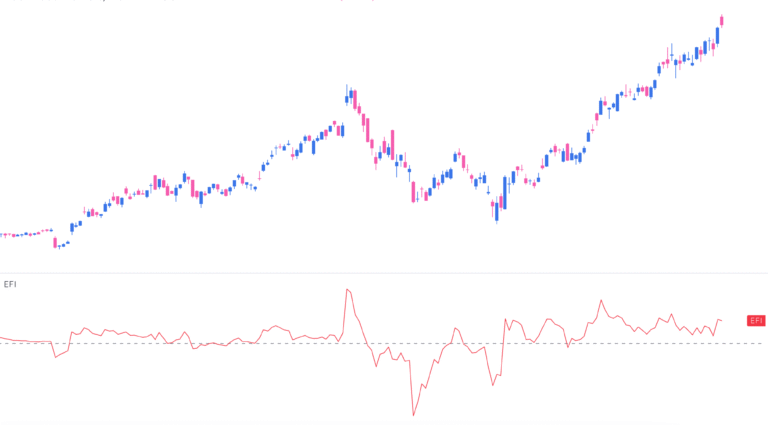
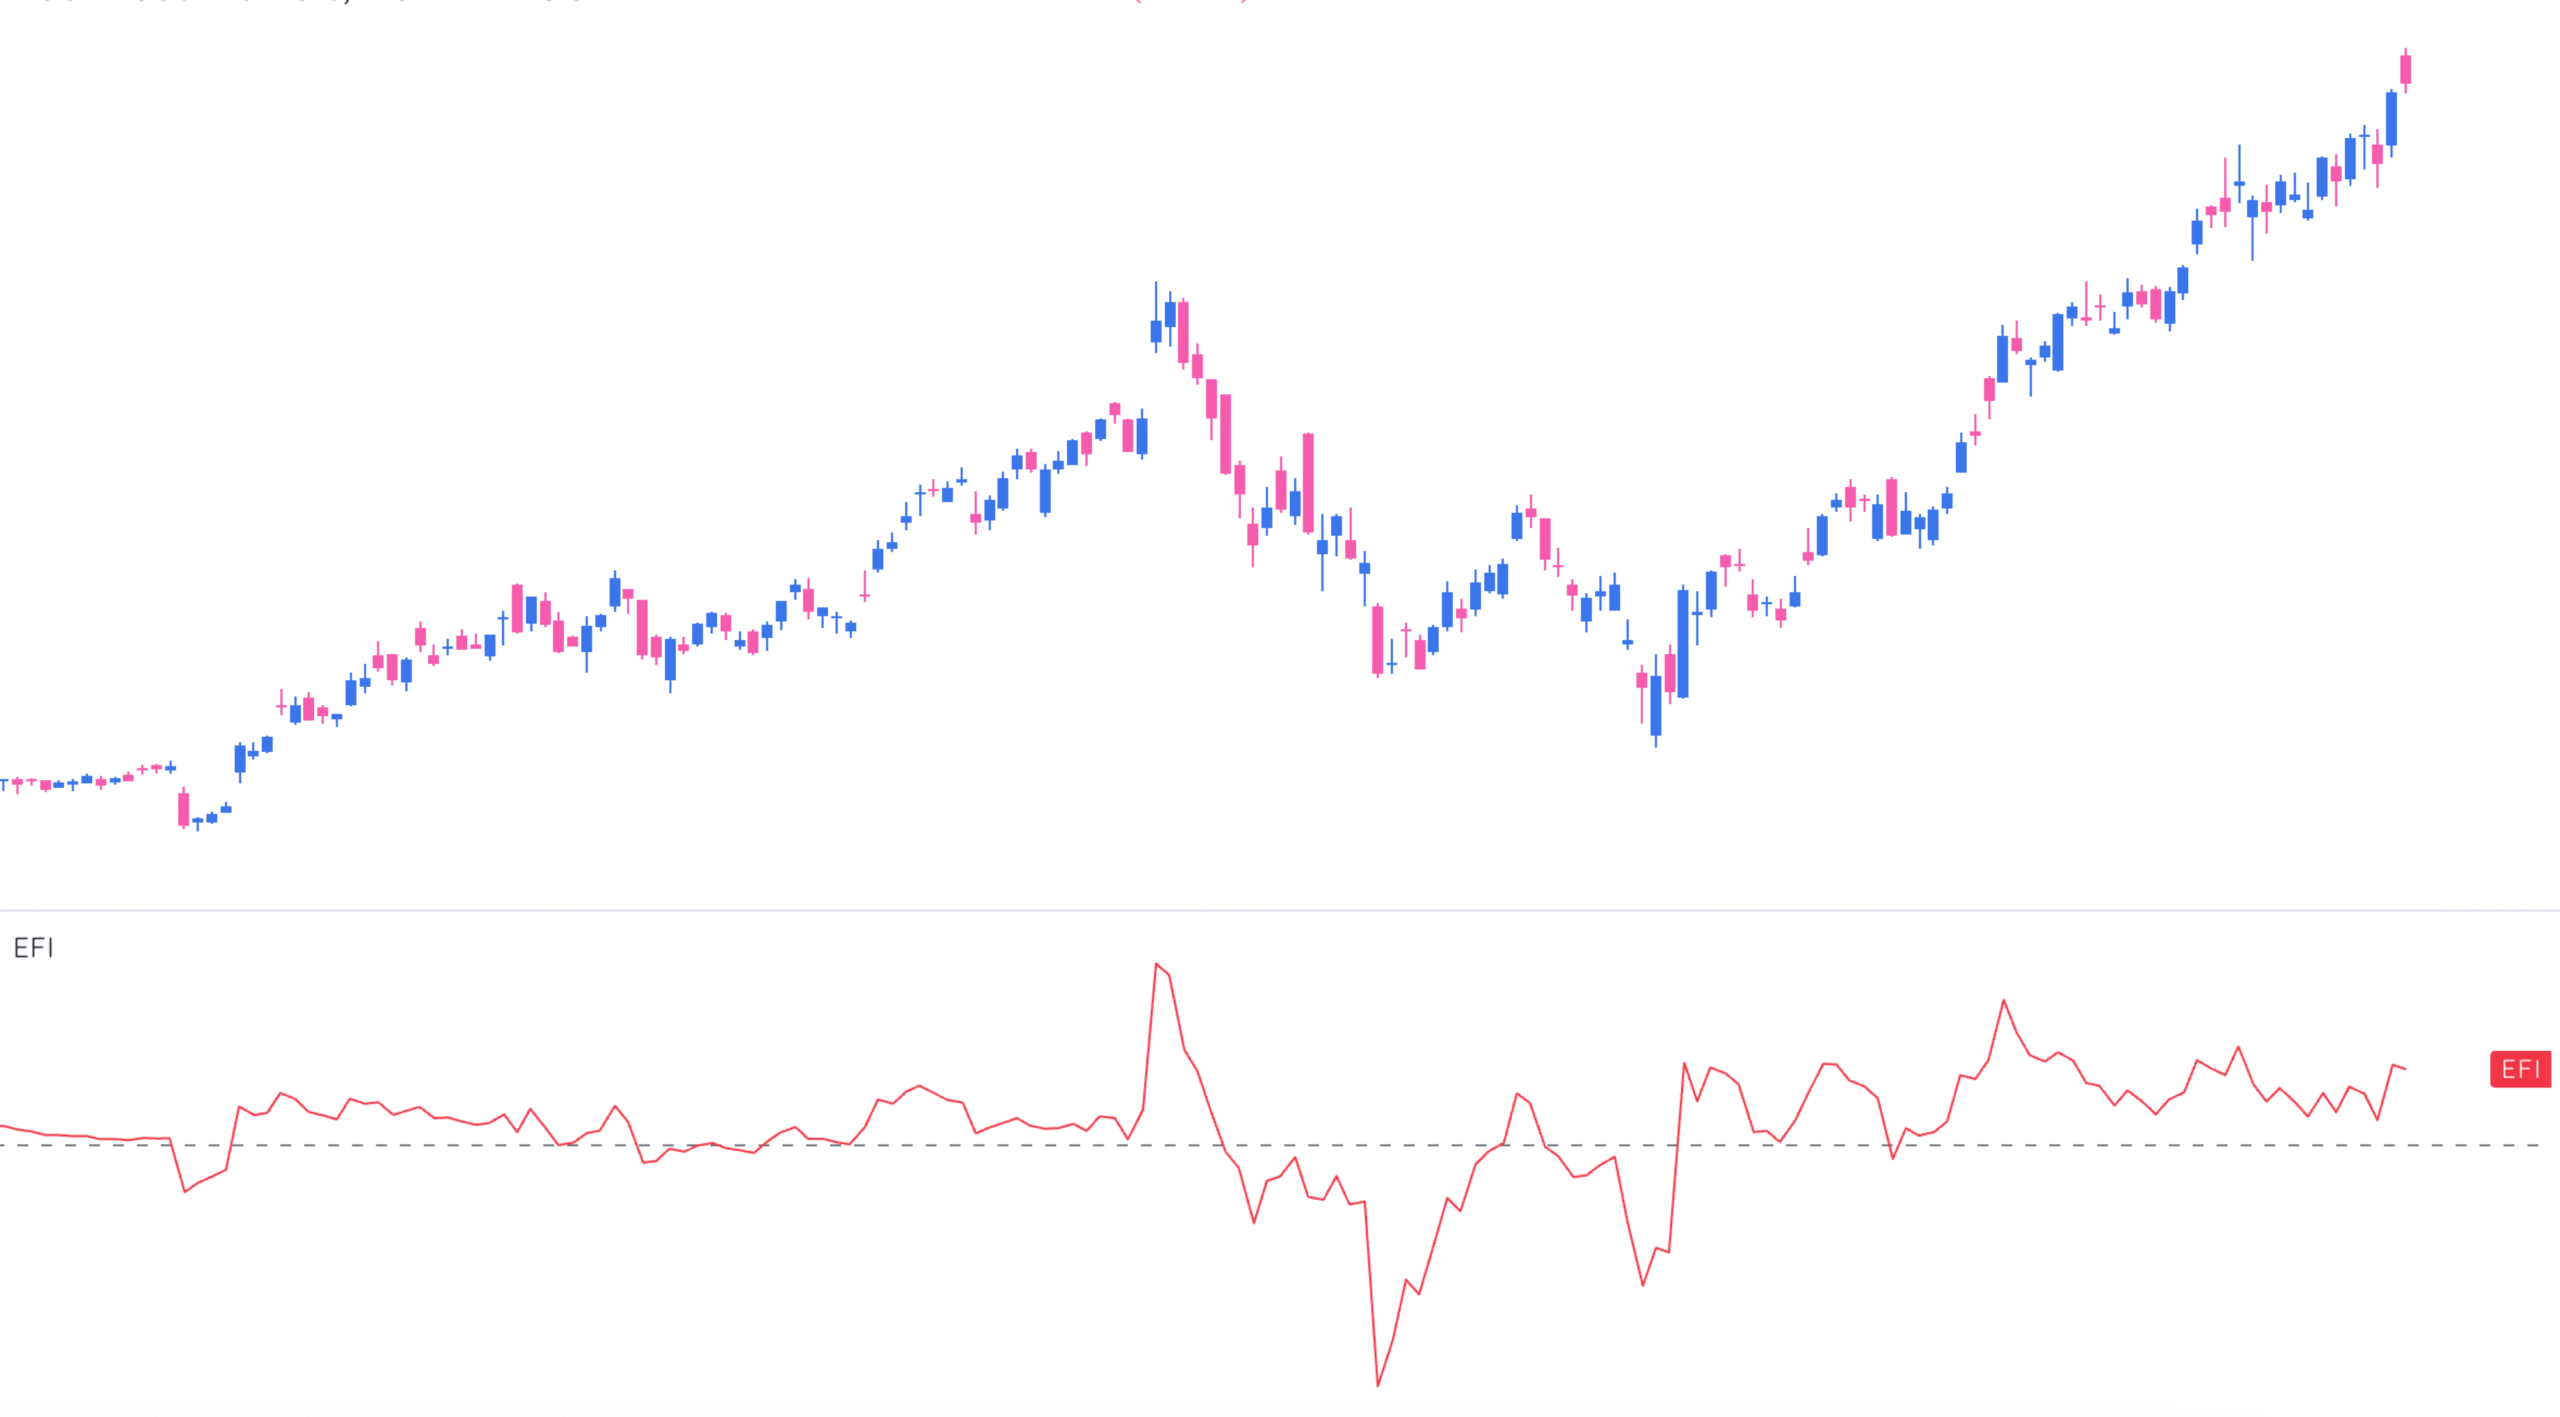
The result is plotted as a histogram with a zero line:
- Above zero: Bullish force
- Below zero: Bearish force
- On zero: No winner. Everyone’s tired.
If the price barely moves but volume spikes, expect drama soon. If price moves big but volume is light, the move’s probably fake.
Smoothing It with Moving Averages
The raw Force Index jumps around. Traders smooth it using EMAs—either to zoom in or zoom out.
Short-Term: 2-Day EMA
Use this for short bursts of momentum. It reacts fast. Great for day traders who live on lower timeframes and questionable amounts of caffeine.
- Buy when the 2-day EMA dips below zero and reverses upward
- Sell when it crosses from above zero to below
Long-Term: 13-Day EMA
This version filters out noise and spots real trends. It’s for swing traders or anyone with enough patience to let a setup breathe.
- Above zero: Bulls have control
- Below zero: Bears run the show
The 13-day EMA also makes divergences easier to see—more on that below.
How to Read Force Index Like a Trader
Basic Signals
- Strong Uptrend: Positive force with increasing volume
- Strong Downtrend: Negative force with increasing volume
- Weak Trend: Flattening index with low volume
- Reversal Warning: Flattening index while volume spikes
Divergences (Your Early Warning System)
This is where things get interesting.
- Bullish Divergence: Price makes lower lows, but the Force Index makes higher lows
- Bearish Divergence: Price makes higher highs, but the Force Index makes lower highs
Divergences matter more when the 13-day EMA crosses the zero line at the same time. That’s your cue the shift isn’t just noise—it’s a regime change.
How Traders Actually Use It
Spotting Entries and Exits
Entry: When the 2-day EMA of EFI turns positive after being negative (momentum flipping bullish)
Exit: When the EFI shifts from positive to negative, or starts flattening with volume fading
For visual traders, Launch Pad – The Early Entry Technique offers a helpful companion.
Confirming Breakouts
If a breakout through resistance is paired with a rising Force Index, bulls mean business. Same goes for bearish breakdowns—if volume and force increase, it’s not a head fake.
You can pair this with Powerful Stock Technical Patterns for a stronger signal.
Trend-Following
Use the 13-day EMA of the Force Index to filter trades:
- Only take long setups when the 13-day EFI is positive
- Only short when it’s negative
Don’t trade against the wind. Especially when it’s blowing hard.
Why Use the Force Index?
- It combines price and volume. That’s rare. Most indicators ignore one or the other.
- It adapts to different styles. Fast-moving for scalpers, smoothed for swing traders.
- It plays well with others. Layer it with RSI, moving averages, or Bollinger Bands.
Limitations (Because Nothing’s Magic)
- Lag with longer EMAs: Don’t expect surgical precision on fast moves.
- Whipsaws on low timeframes: Especially in choppy, low-volume markets.
- Needs confirmation: Use it as one voice in a chorus, not a solo act.
How It Fits in Real Strategies
1. Day Trading
Use the 2-day EMA of the Force Index:
- Look for EFI flipping positive for buy entries
- Exit when EFI peaks and volume fades
- Confirm with price action (breakouts, consolidations, etc.)
2. Swing Trading
Use the 13-day EMA:
- Buy on pullbacks when the 13-day EFI stays positive
- Watch for divergences at major levels
- Exit when the trend starts flattening on both price and force
This approach complements insights from our Swing Trading vs. Options Trading breakdown.
3. Pair with Other Indicators
- Moving Averages: For trend direction
- RSI: To avoid entering into overbought or oversold setups
- Bollinger Bands: To confirm volatility expansion during breakouts
Final Word
The Force Index does what most indicators don’t: it shows who’s pushing and how hard. Whether you trade the open or hold for weeks, understanding the strength behind price action matters.
Just don’t use it in isolation. Combine it with volume, trend filters, and your actual brain. Elder built the tool—but it’s on you to wield it properly.


