The Money Flow Index: A Smarter Way to Watch the Tape
If “money talks,” then in financial markets, it screams. Most traders stare at price charts. A few smarter ones watch where the money’s actually going. The Money Flow Index (MFI) helps you do just that.
It tracks both price action and volume, showing not just what’s moving, but why. Think of it as adding another layer to your charts: price says what’s happening, MFI says how much conviction is behind it.
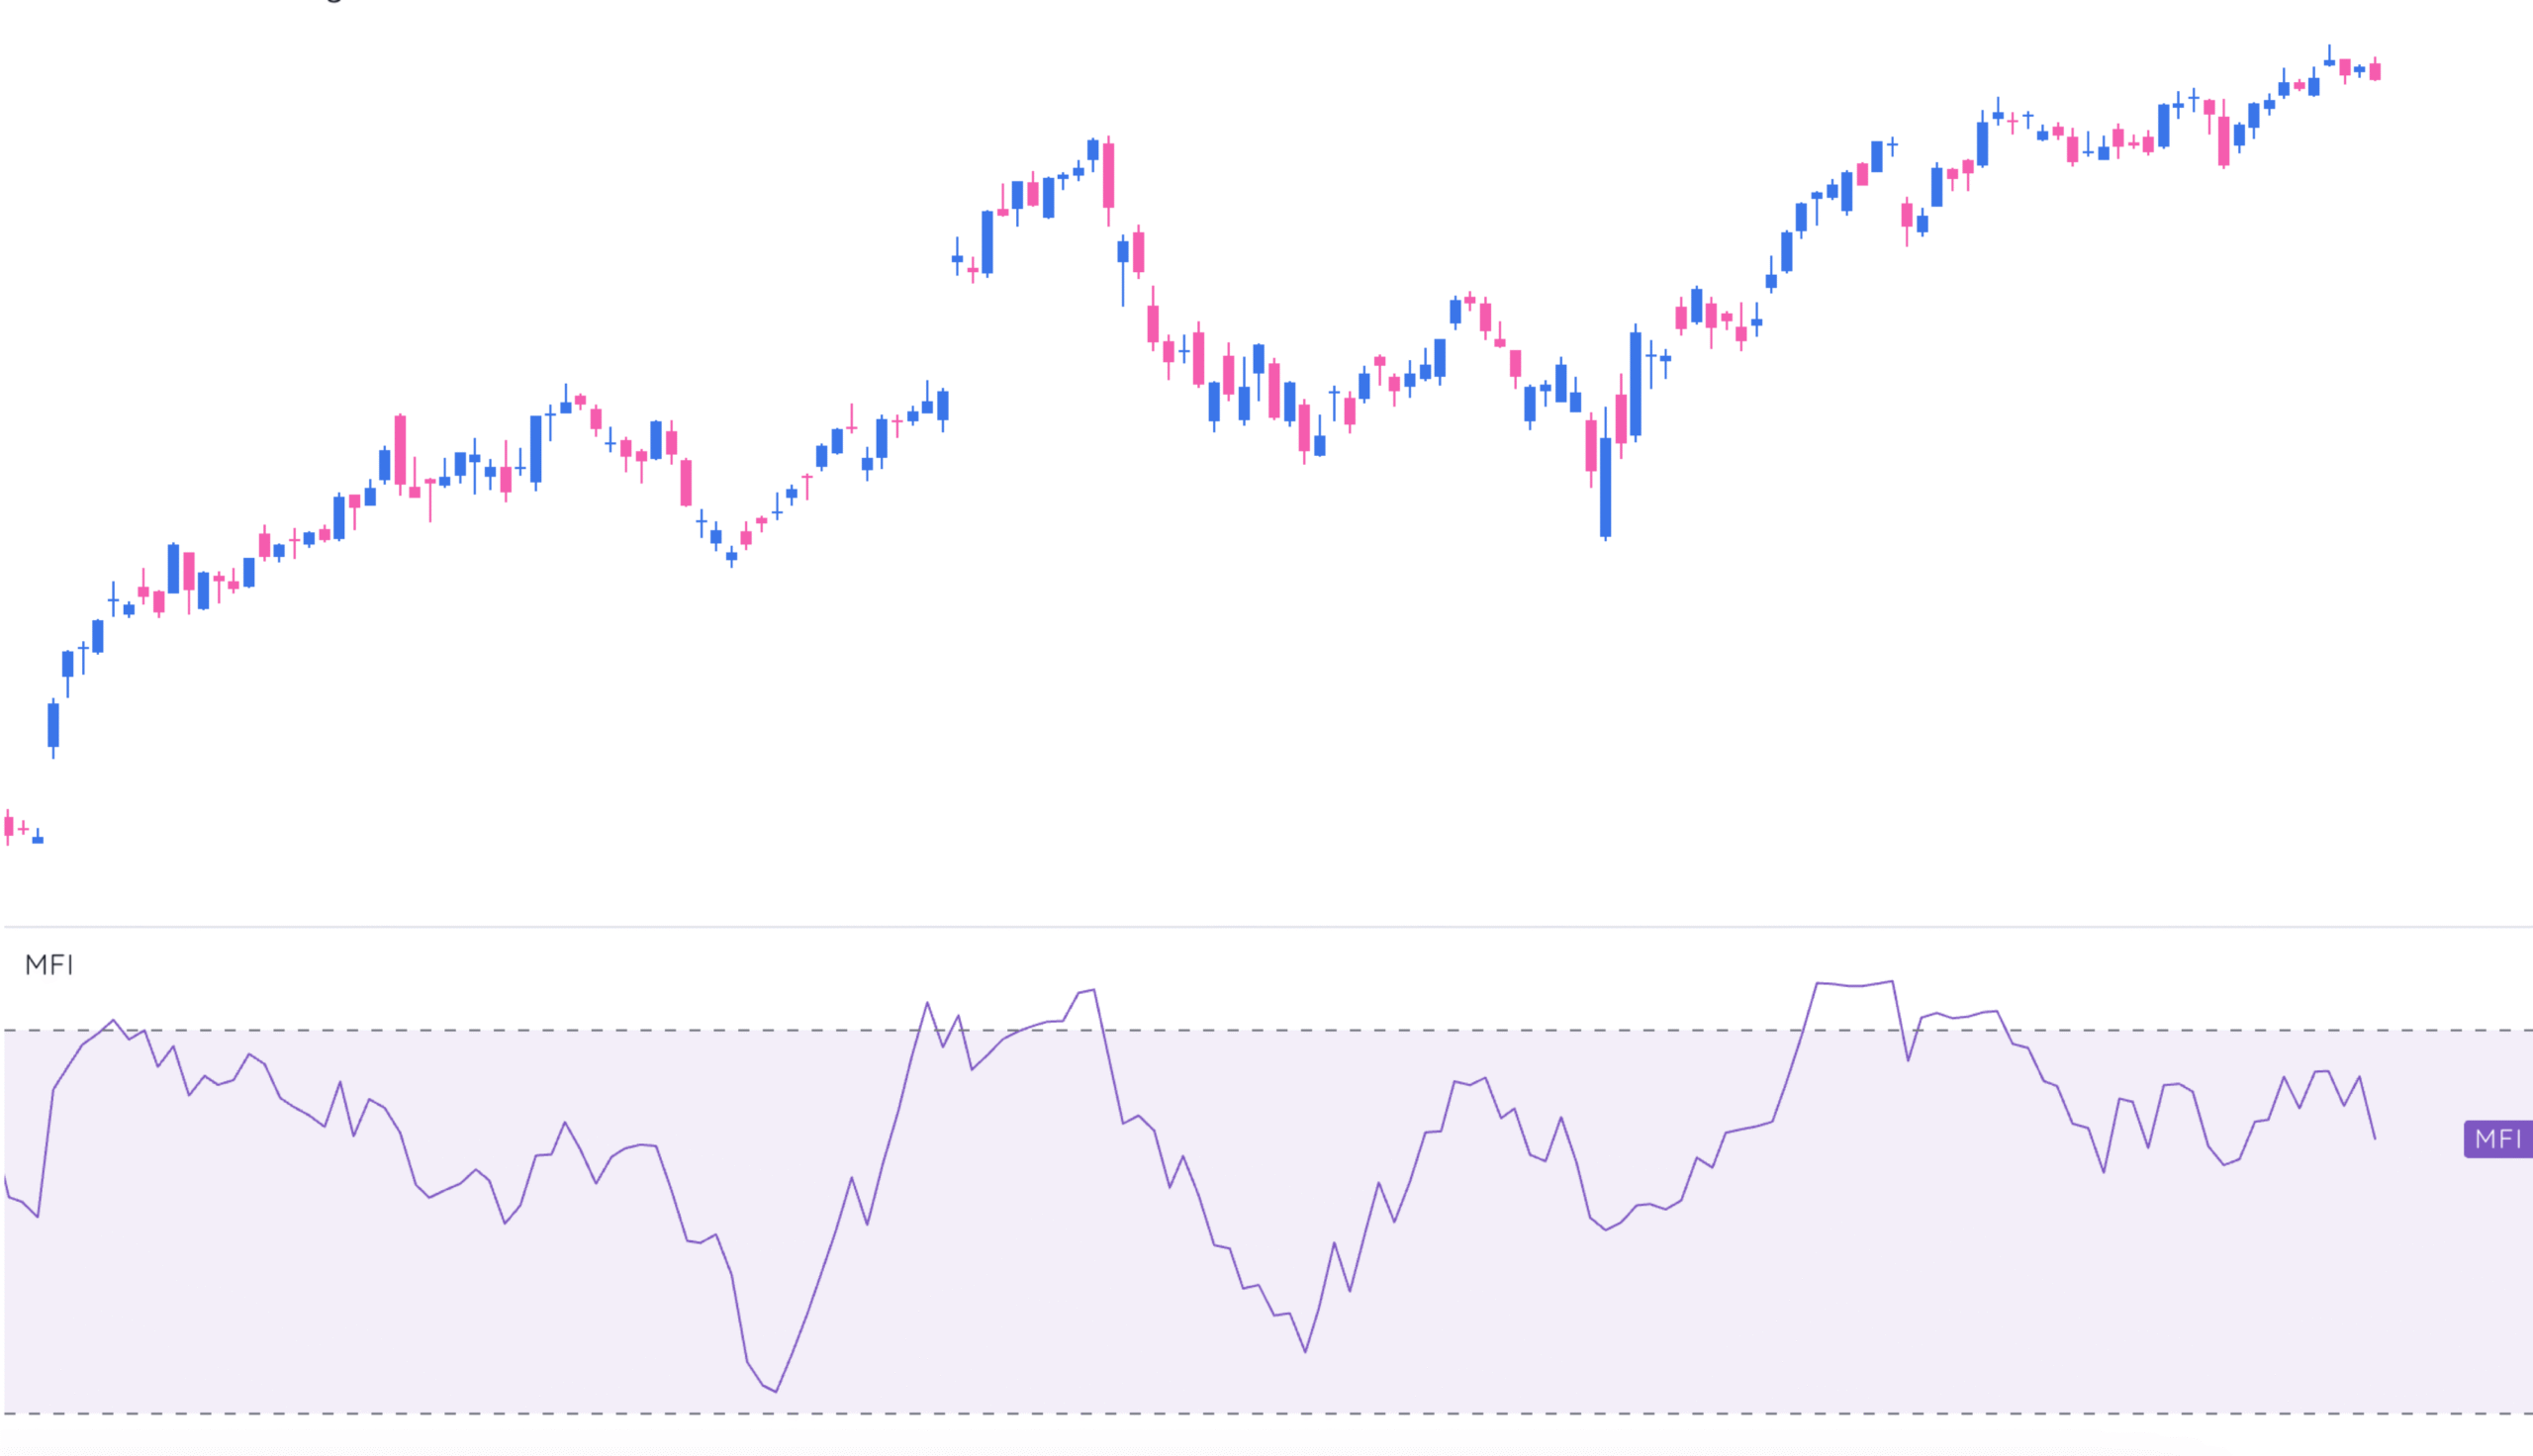
The MFI oscillates between 0 and 100. High readings suggest buying pressure is maxed out. Low readings point to selling exhaustion. Watch it closely during extremes or when it diverges from price—these moments often foreshadow trend changes before they hit the mainstream radar.
What Is the Money Flow Index?
At its core, MFI is a momentum indicator that blends price and volume. While RSI looks only at price moves, MFI asks a deeper question: How much money is actually following this price?
It calculates the typical price for each period, multiplies that by volume, then tracks how money is flowing in or out over time. The result: a reading that cuts through the noise and highlights when market sentiment shifts.
How to Calculate MFI (Without Getting a Headache)
Here’s the sequence:
- Typical Price = (High + Low + Close) ÷ 3
- Raw Money Flow = Typical Price × Volume
- If today’s Typical Price is higher than yesterday’s → Positive Money Flow
If lower → Negative Money Flow - Money Flow Ratio = Positive Money Flow ÷ Negative Money Flow (over 14 periods)
- Money Flow Index = 100 − [100 ÷ (1 + Money Flow Ratio)]
That’s it. No rocket science. And yes, most modern platforms handle this for you—no need for a spreadsheet. But knowing the math helps you trust the signals.
How Traders Actually Use MFI
Spotting Extremes
When MFI climbs above 80, the market is likely overbought. Sellers are circling. Below 20, it’s oversold—think rubber band stretched too far.
But here’s the nuance: in strong trends, MFI can stay extreme for a while. You don’t auto-sell at 81 or buy at 19. Watch how MFI behaves at these levels: reversals, failure swings, or divergences are where the real signals emerge.
Watching for Divergence
This is MFI’s sweet spot. When price and MFI disagree, pay attention:
- Bearish Divergence: Price makes a higher high, MFI makes a lower high → buyers are tiring.
- Bullish Divergence: Price hits a new low, MFI hits a higher low → sellers losing steam.
These can warn you well before momentum shifts become obvious in price alone. For more techniques, check out 5 screens to find breakout stocks.
Timing Entries in Trends
Another use case: timing pullbacks. In uptrends, MFI dips toward 40 often mark strong buy zones. In downtrends, MFI spikes toward 60 signal potential short setups.
This works because MFI shows participation behind price moves. Price alone can’t tell you if there’s real muscle behind the rally or selloff. MFI can. Pair this with screeners for stock market corrections for better setups.
MFI vs RSI: Why Bother With Both?
RSI is price-only. MFI adds volume—giving it more context.
Because volume often leads price, MFI sometimes catches shifts earlier than RSI. Think of RSI as “what’s moving” and MFI as “what’s moving, and with how much force.”
In calm trends, both work fine. In inflection points—when institutions quietly shift positions—MFI’s sensitivity can give you the edge. This is where Stage Analysis can also enhance your view.
Limitations to Keep in Mind
Like any tool, MFI has blind spots.
- Persistent trends: In strong moves, MFI can stay extreme longer than your nerves. Don’t treat it as a magic reversal button.
- External shocks: No indicator can price in unexpected news or black swans. Always layer MFI with other signals and risk management.
Final Thoughts
The Money Flow Index offers a clearer window into market conviction. It lets you test whether a rally is real, spot fading moves early, and time entries with more precision.
But it’s no silver bullet. Use MFI alongside other tools. Confirm setups with price action. Stay flexible. That’s how you turn indicators from curiosity into edge.


