Chande Momentum Oscillator (CMO): A Complete Guide to Identifying Market Momentum
Deepvue
Last Updated:
June 18, 2024
The Chande Momentum Oscillator (CMO) is a technical momentum indicator developed by Tushar Chande, first introduced in his 1994 book, The New Technical Trader. The CMO helps traders identify overbought and oversold market conditions and spot potential entry and exit points. It is particularly useful because it accounts for both gains and losses over a defined period, providing a clear picture of market momentum.
Calculation of the Oscillator
Sum of Recent Gains and Losses
- Gains are the positive differences between the current and previous closing prices.
- Losses are the negative differences between the current and previous closing prices.
Ratio of Gains to Total Price Moves
The CMO is calculated as:
CMO = [(Sum of Gains - Sum of Losses) / (Sum of Gains + Sum of Losses)] * 100
Or alternatively:
CMO = 100 * ((Su - Sd) / (Su + Sd))
Where:
- Su = Sum of differences on up days over the specified period (commonly 14 or 20 days).
- Sd = Sum of absolute differences on down days over the same period.
The CMO value ranges from -100 to +100, providing a normalized scale of momentum.
Interpretation
Overbought and Oversold Levels
- Above +50 → Overbought condition (possible price correction)
- Below -50 → Oversold condition (possible price rebound)
Trading Signals
- Buy Signal → CMO crosses above a lower threshold (e.g., -50 or -30), indicating upward momentum.
- Sell Signal → CMO crosses below an upper threshold (e.g., +50 or +30), indicating downward momentum.
Traders often add a 9-period moving average to the CMO as a signal line to confirm entries and exits.

How This Indicator Works
- Trend Strength: The higher the absolute value of the CMO, the stronger the trend.
- Sideways Trading: Lower absolute values indicate a range-bound or consolidating market.
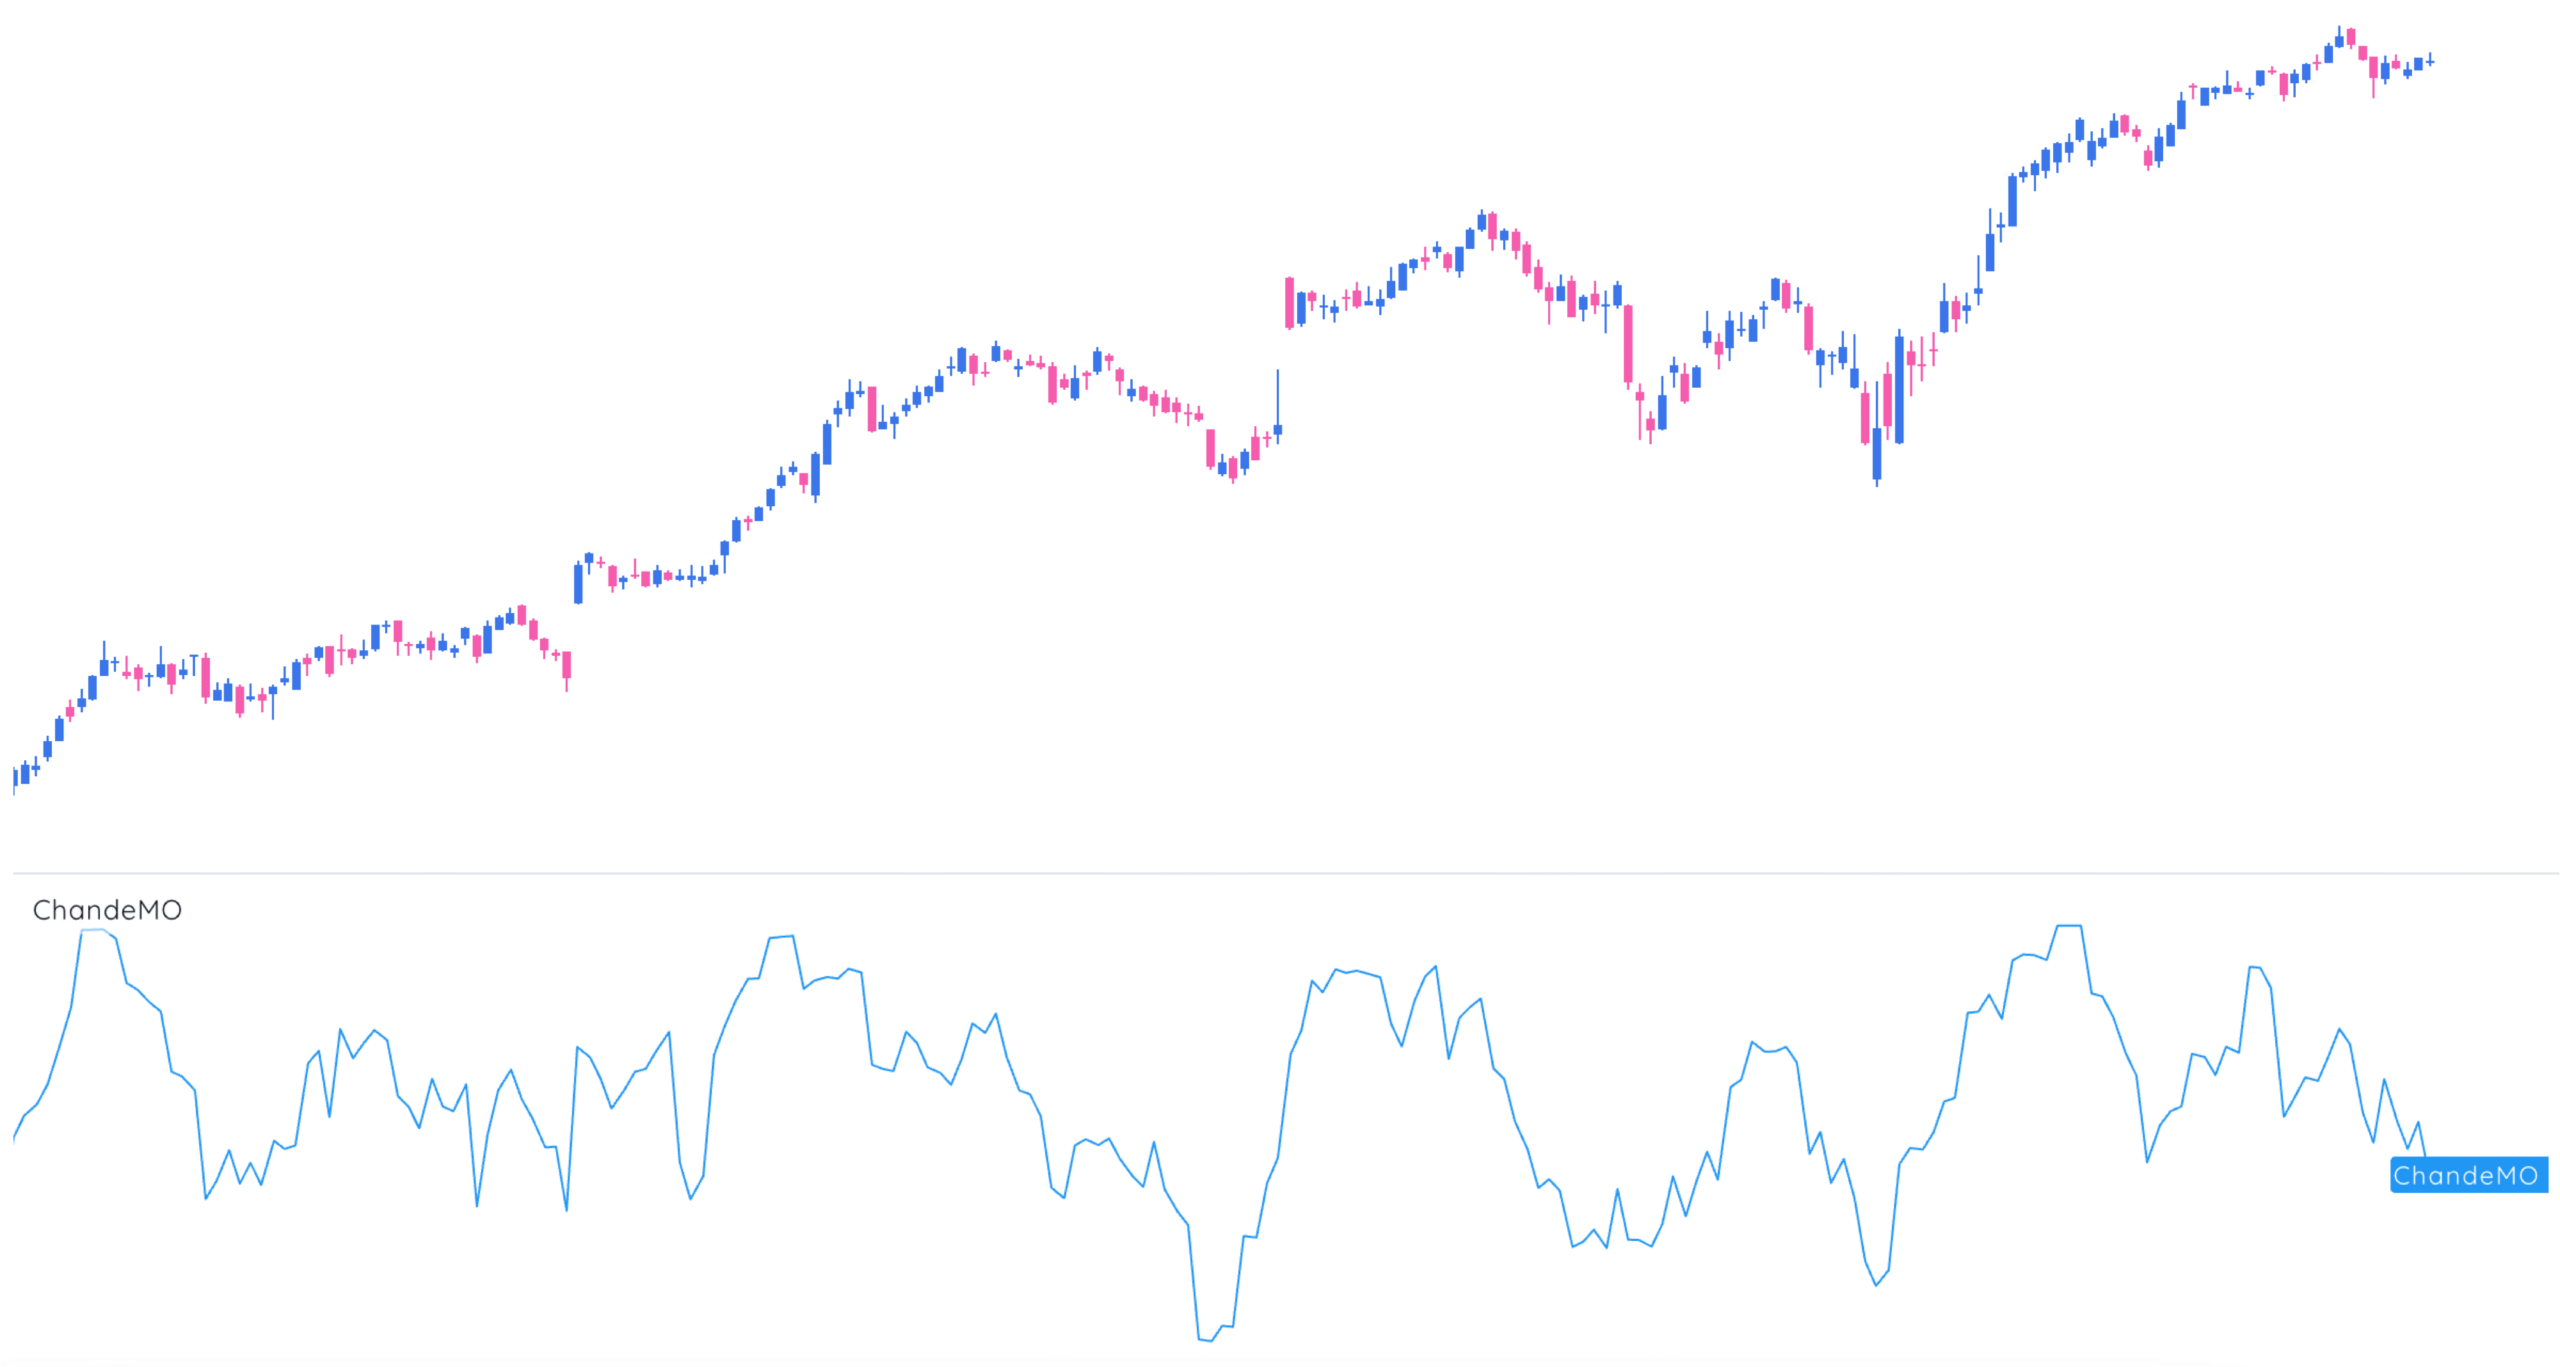
- Divergences: When price makes a new high or low not confirmed by the CMO, this divergence can signal a reversal.
Combining with Other Indicators
To improve reliability, traders often combine the CMO with:
- Trend indicators (e.g., Moving Averages, Average Directional Index – ADX)
- Support and resistance levels
- Chart patterns (double tops, bottoms, trendlines on the CMO itself)
This combination helps filter out false signals and enhances overall trading performance.
Advantages
- Identifies overbought/oversold conditions.
- Generates clear trading signals.
- Applicable to multiple instruments (stocks, commodities, currencies) and timeframes.
Limitations
- May produce false signals, especially in trending markets.
- Effectiveness varies with market conditions.
- Best used with additional tools to confirm signals.
Example of Use
- Divergence: If an asset is making new highs but the CMO is declining → possible bearish divergence.
- Signal confirmation: A moving average crossover in price confirmed by CMO crossing 0 strengthens a buy/sell case.
CMO vs. Stochastic Oscillator
| Aspect | Chande Momentum Oscillator | Stochastic Oscillator |
|---|---|---|
| Basis | Momentum, unsmoothed | Smoothed momentum |
| Range | -100 to +100 | 0 to 100 |
| Strength | More sensitive | Smoother signals |
| Crossover | Optional signal line | Built-in crossover signal line |
The Bottom Line
The Chande Momentum Oscillator is a powerful tool for measuring market momentum and identifying potential reversals. While it has limitations, combining the CMO with other technical and fundamental tools can help traders create more robust trading strategies.


