What Is the Volume Oscillator?
The Volume Oscillator (VO) is a momentum tool. But unlike your standard RSI or MACD, it doesn’t track price. It tracks the one thing that tells you if a move actually means something: volume.
More specifically, it measures the percentage difference between two moving averages of volume. When the short-term average moves above the long-term average, the oscillator turns positive. Below? Negative.
Simple. And very telling.
How It Works
The Formula for Volume Oscillator (VO)
Here’s the math traders use:
VO = [(Short-Term Volume MA – Long-Term Volume MA) / Long-Term Volume MA] × 100Common setups:
- Short-Term MA: 5 or 14 periods
- Long-Term MA: 20 or 28 periods
Most charting platforms let you tweak these inputs. Shorter for quick trades. Longer if you’re swinging or position sizing (External).
How to Read Volume Oscillator?
Above Zero
Short-term volume is outpacing the long-term average. More traders are showing up. The market has energy.
Below Zero
Volume is shrinking. Momentum is fading. Buyer enthusiasm is drying up—or sellers are asleep.
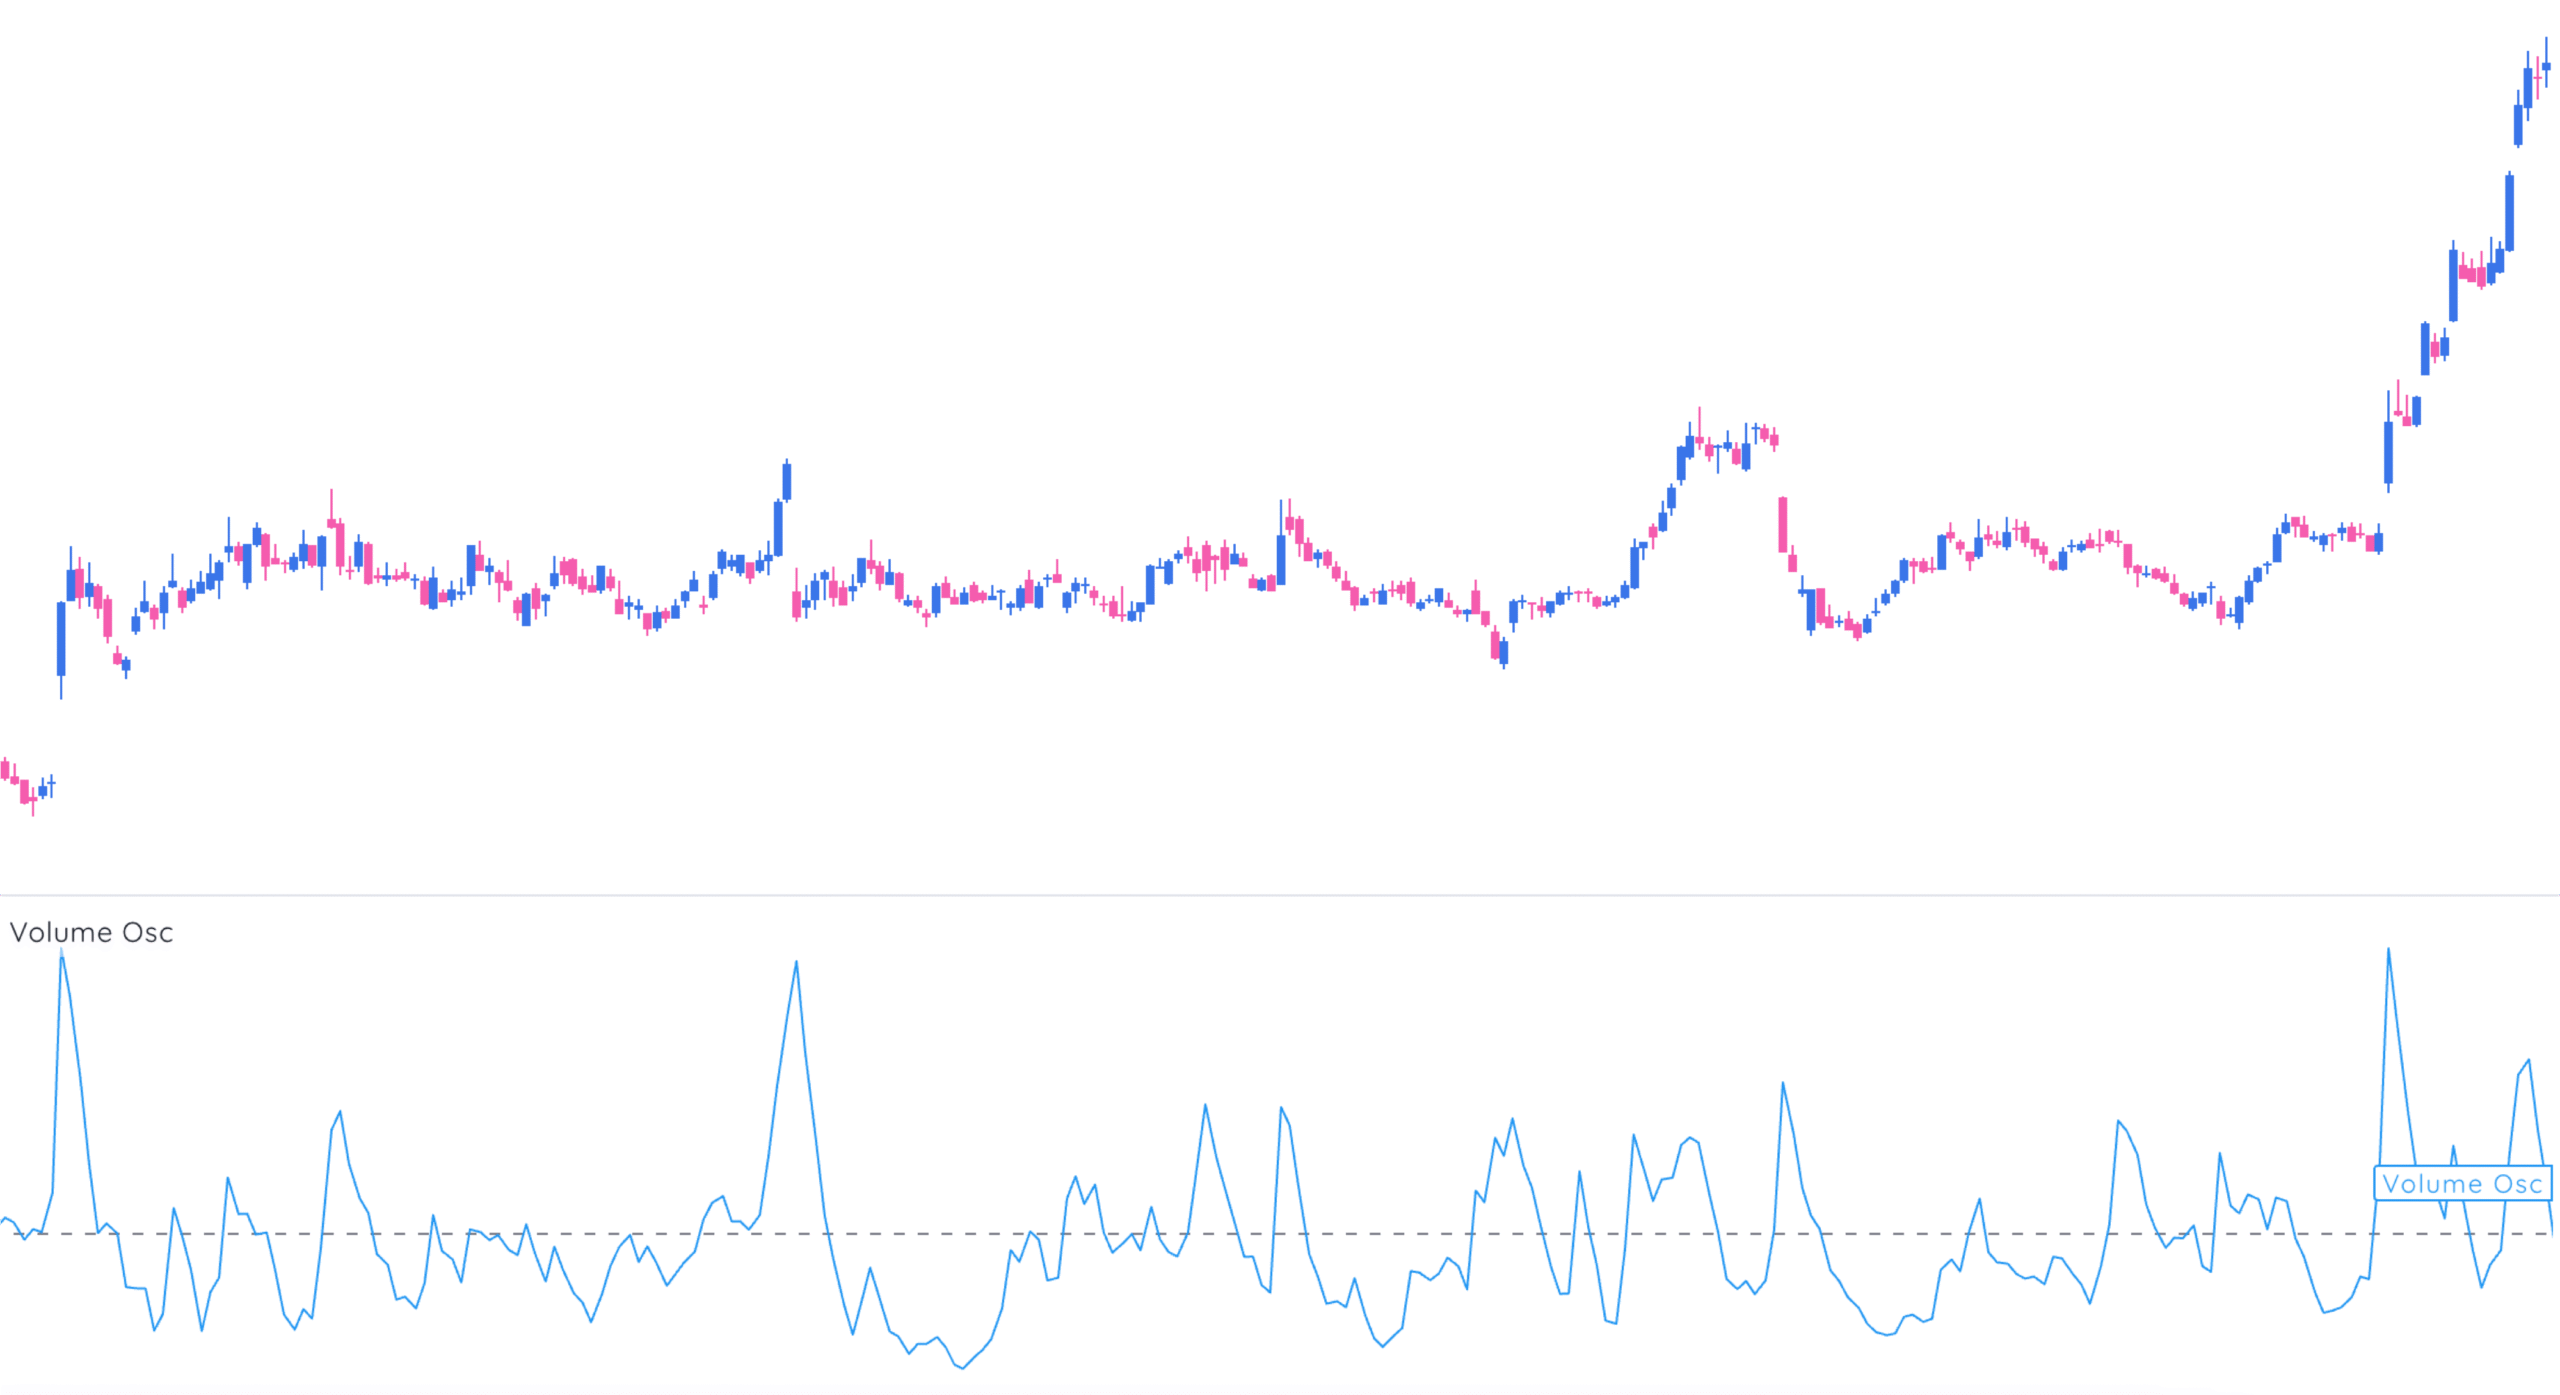
The histogram swings above and below a zero line, creating a visual read on volume momentum.
How to Use Volume Oscillator?
1. Confirming Breakouts
You’ve seen this before: price breaks resistance, but on weak volume. Spoiler: the breakout usually fails.
VO tells you if there’s conviction behind the move.
- Resistance break + rising VO = real move
- Support break + rising VO = panic sell-off
If you want more conviction-based trades, look into 5 screens to find breakout stocks.
2. Spotting Divergences
A rising price with a falling VO? Classic red flag. Volume is bailing while price drifts upward. Not a bullish combo.
The opposite is true too. Price stagnates, but VO starts climbing—buyers are quietly stepping in. Time to pay attention.
3. Identifying Trend Strength
VO rising? The trend has fuel.
VO flattening or falling? Watch your back.
During uptrends, you want volume increasing. In corrections, you want volume shrinking.
For a broader understanding, see this breakdown of the 4 Stock Market Cycles.
Key Setups to Watch
Bullish
- VO crosses above zero on breakout
- VO climbs with price
- VO divergence with flat/down price (accumulation)
Bearish
- VO drops below zero on breakdown
- VO falling while price rises
- VO divergence with rising price (distribution)
Want to dive deeper into spotting distribution? Explore this case study on distribution days.
Limitations (Yes, It Has Some)
- Works best as confirmation, not a standalone signal
- False signals in low-liquidity names
- Can be noisy in sideways chop
- Doesn’t account for price volatility—use with other tools like RSI or ATR
Final Word
Volume isn’t glamorous. But it’s one of the most honest indicators out there. Volume Oscillator just makes it easier to read.
If you care about trend strength and hate getting faked out, this one’s worth a spot on your chart.
Just remember: no single indicator is gospel. The pros stack context, not just signals.


