Last Updated:
June 12, 2024
What Is the Accumulation/Distribution Line?
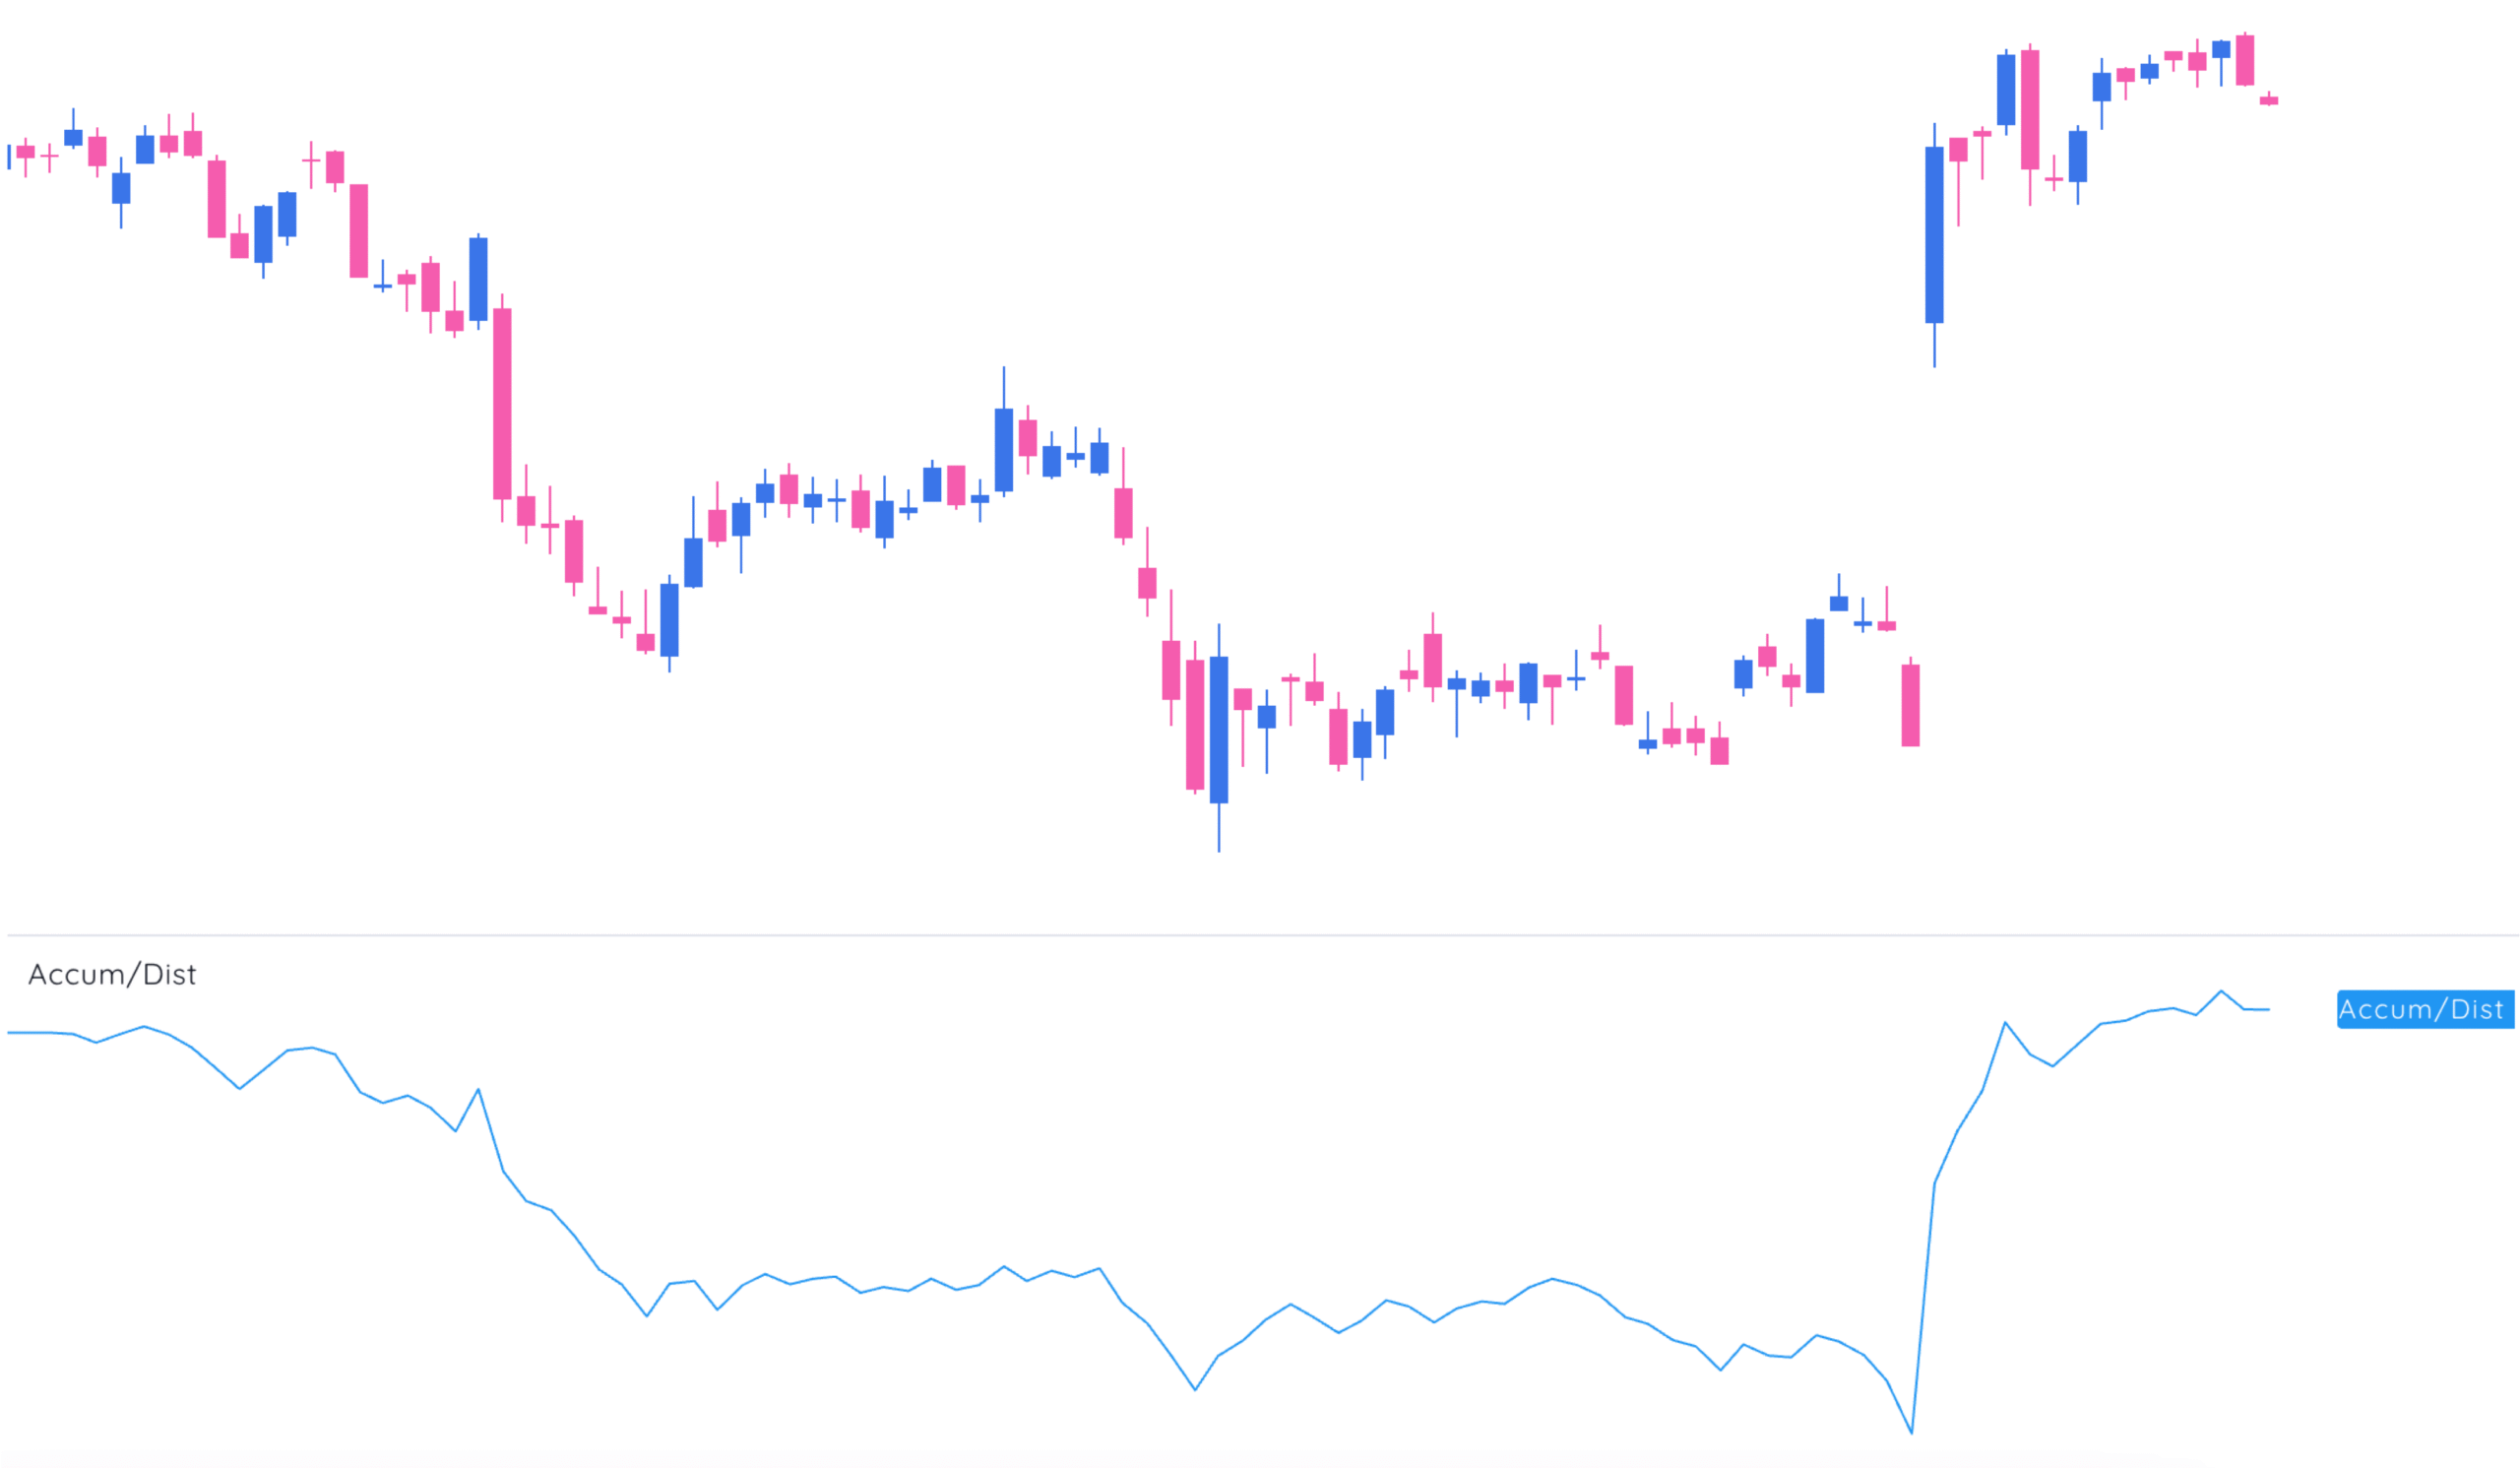
The Accumulation/Distribution Line (ADL) is a running tally of who’s quietly soaking up shares and who’s quietly unloading. Created by Marc Chaikin, it’s a volume-based indicator that helps you gauge buying and selling pressure based on where a stock closes in its daily range.
No fluff: it doesn’t care where today’s close is relative to yesterday. It cares where the close sits within the high-low range of today’s session. If you close near the top? Buyers had the wheel. Near the bottom? Sellers were driving.
How It’s Calculated (Without the Headache)
Here’s the formula, broken into steps:
- Money Flow Multiplier
This tells you if the close was strong or weak within the day’s range. Outputs between -1 and +1.
- Money Flow Volume
Multiply the multiplier by volume. - Accumulation/Distribution Line (ADL)
Add each period’s Money Flow Volume to the previous ADL value.
That’s it. The line goes up when buying pressure outweighs selling pressure, and down when the opposite happens.
What the ADL Tells You (When It’s Telling the Truth)
1. Trend Confirmation
- Price going up and ADL going up? Trend’s likely real.
- Price falling and ADL falling? Downtrend has weight behind it.
2. Divergences
- Bullish divergence: Price makes lower lows, ADL makes higher lows → stealth accumulation.
- Bearish divergence: Price makes new highs, ADL fades → silent distribution.
Volume precedes price. If ADL is whispering before price starts shouting, pay attention.
ADL vs. On-Balance Volume (OBV)
| Feature | ADL (Accumulation/Distribution Line) | OBV (On-Balance Volume) |
|---|---|---|
| Calculation Basis | Focuses on where the close is within the current day’s range (high to low). | Compares today’s close to the previous day’s close. |
| Volume Adjustment Logic | Uses a multiplier based on close position to weight volume—more nuanced. | Adds or subtracts full volume based on whether price closed up or down. |
| Sensitivity to Intraday Moves | Captures intraday strength or weakness effectively. | Ignores intraday price structure; focuses only on day-over-day close. |
| Example Behavior | A gap down that closes near the high → ADL rises. | Same scenario → OBV falls, since it only sees a down day. |
| Best Use Case | Spotting stealth accumulation/distribution; analyzing volume in the context of price action. | Simple trend confirmation in longer timeframes. |
Example Interpretation: A stock that gaps down but closes near the high of the day will show a rise in ADL, signaling potential accumulation. OBV, on the other hand, would subtract volume due to the close being lower than the previous day, missing the intraday strength.
For more clarity on relative strength techniques, check out how to use the relative strength line to reinforce volume analysis.
Real World Use: Trend or Trap?
Confirming Trends:
If price and ADL are in sync—great. That means the volume is backing up the move.
This is similar to setups discussed in How to Find Winning Stocks with Relative Strength where volume and price alignment play a crucial role.
Spotting Reversals:
Divergences are the money spots. Always wait for a price confirmation, but the early warning system is real.
Weak Spots: When ADL Doesn’t Work
Let’s be clear: ADL isn’t a crystal ball.
- Price Gaps: It ignores overnight gaps. If a stock gaps big but closes mid-range, ADL yawns.
- Flat Lines: If volume is muted or the price sticks to its mid-range, the signal gets fuzzy.
- Two Degrees from Reality: Price → range position → volume-adjusted signal. That’s two layers of abstraction. So use it alongside other tools.
Pairing ADL With Other Indicators
If ADL is your early alert system, you still need confirmation. These are solid sidekicks:
1. Money Flow Index (MFI)
- Volume-weighted RSI, basically.
- Shows overbought/oversold with more nuance.
- Use to gauge whether pressure is extreme.
2. Relative Strength Index (RSI)
- A clean read on momentum.
- Look for divergence between RSI and price, then check ADL for volume context.
Use MFI to flag exhaustion, RSI to confirm momentum shifts, and ADL to see if volume agrees. Simple three-pronged read.
The Bottom Line
The Accumulation/Distribution Line is not a magic trend detector. It’s a context tool. Use it to:
- Confirm that price trends have real volume behind them.
- Catch early signs of reversal through divergence.
- Avoid traps where the price is moving but volume isn’t backing it.
Just don’t use it alone. Combine it with price action, RSI, MFI, and a healthy dose of skepticism. ADL is best when it confirms what your gut already suspects.


