Last Updated:
May 21, 2024
What Are Pivot Points?
Pivot points are a no-nonsense way to map out support and resistance. Derived from the previous trading session’s high, low, and close, they give traders a structured price roadmap for the day ahead.
They’re not magic. They’re math. And while they don’t predict the future, they do give you levels that traders everywhere are watching—which, in this game, often makes all the difference.
How to Calculate Pivot Points
Here’s the core formula set:
- Pivot Point (P) = (High + Low + Close) / 3
- Resistance 1 (R1) = (P × 2) – Low
- Resistance 2 (R2) = P + (High – Low)
- Support 1 (S1) = (P × 2) – High
- Support 2 (S2) = P – (High – Low)
These five levels create the scaffolding for price action. They’re static, so once calculated at the start of the session, they don’t move—ideal for intraday setups.
How Traders Actually Use Them
1. Trend Bias
If price opens above the pivot and holds, bulls have the ball. Below it? Bears are pressing.
2. Bounce Plays
Buy near support, sell near resistance. It’s simple, but only if you have the discipline to wait.
3. Breakout Setups
A clean break of R1 or S1 with volume? That’s a breakout. Add confirmation with momentum or volume indicators, and it’s a setup, not a guess.
4. Confluence Zones
If a pivot level lines up with a moving average, Fib retracement, or round number, you’ve found a high-interest area. That’s where big trades get made.
Real-World Example: AAPL’s Recent Action
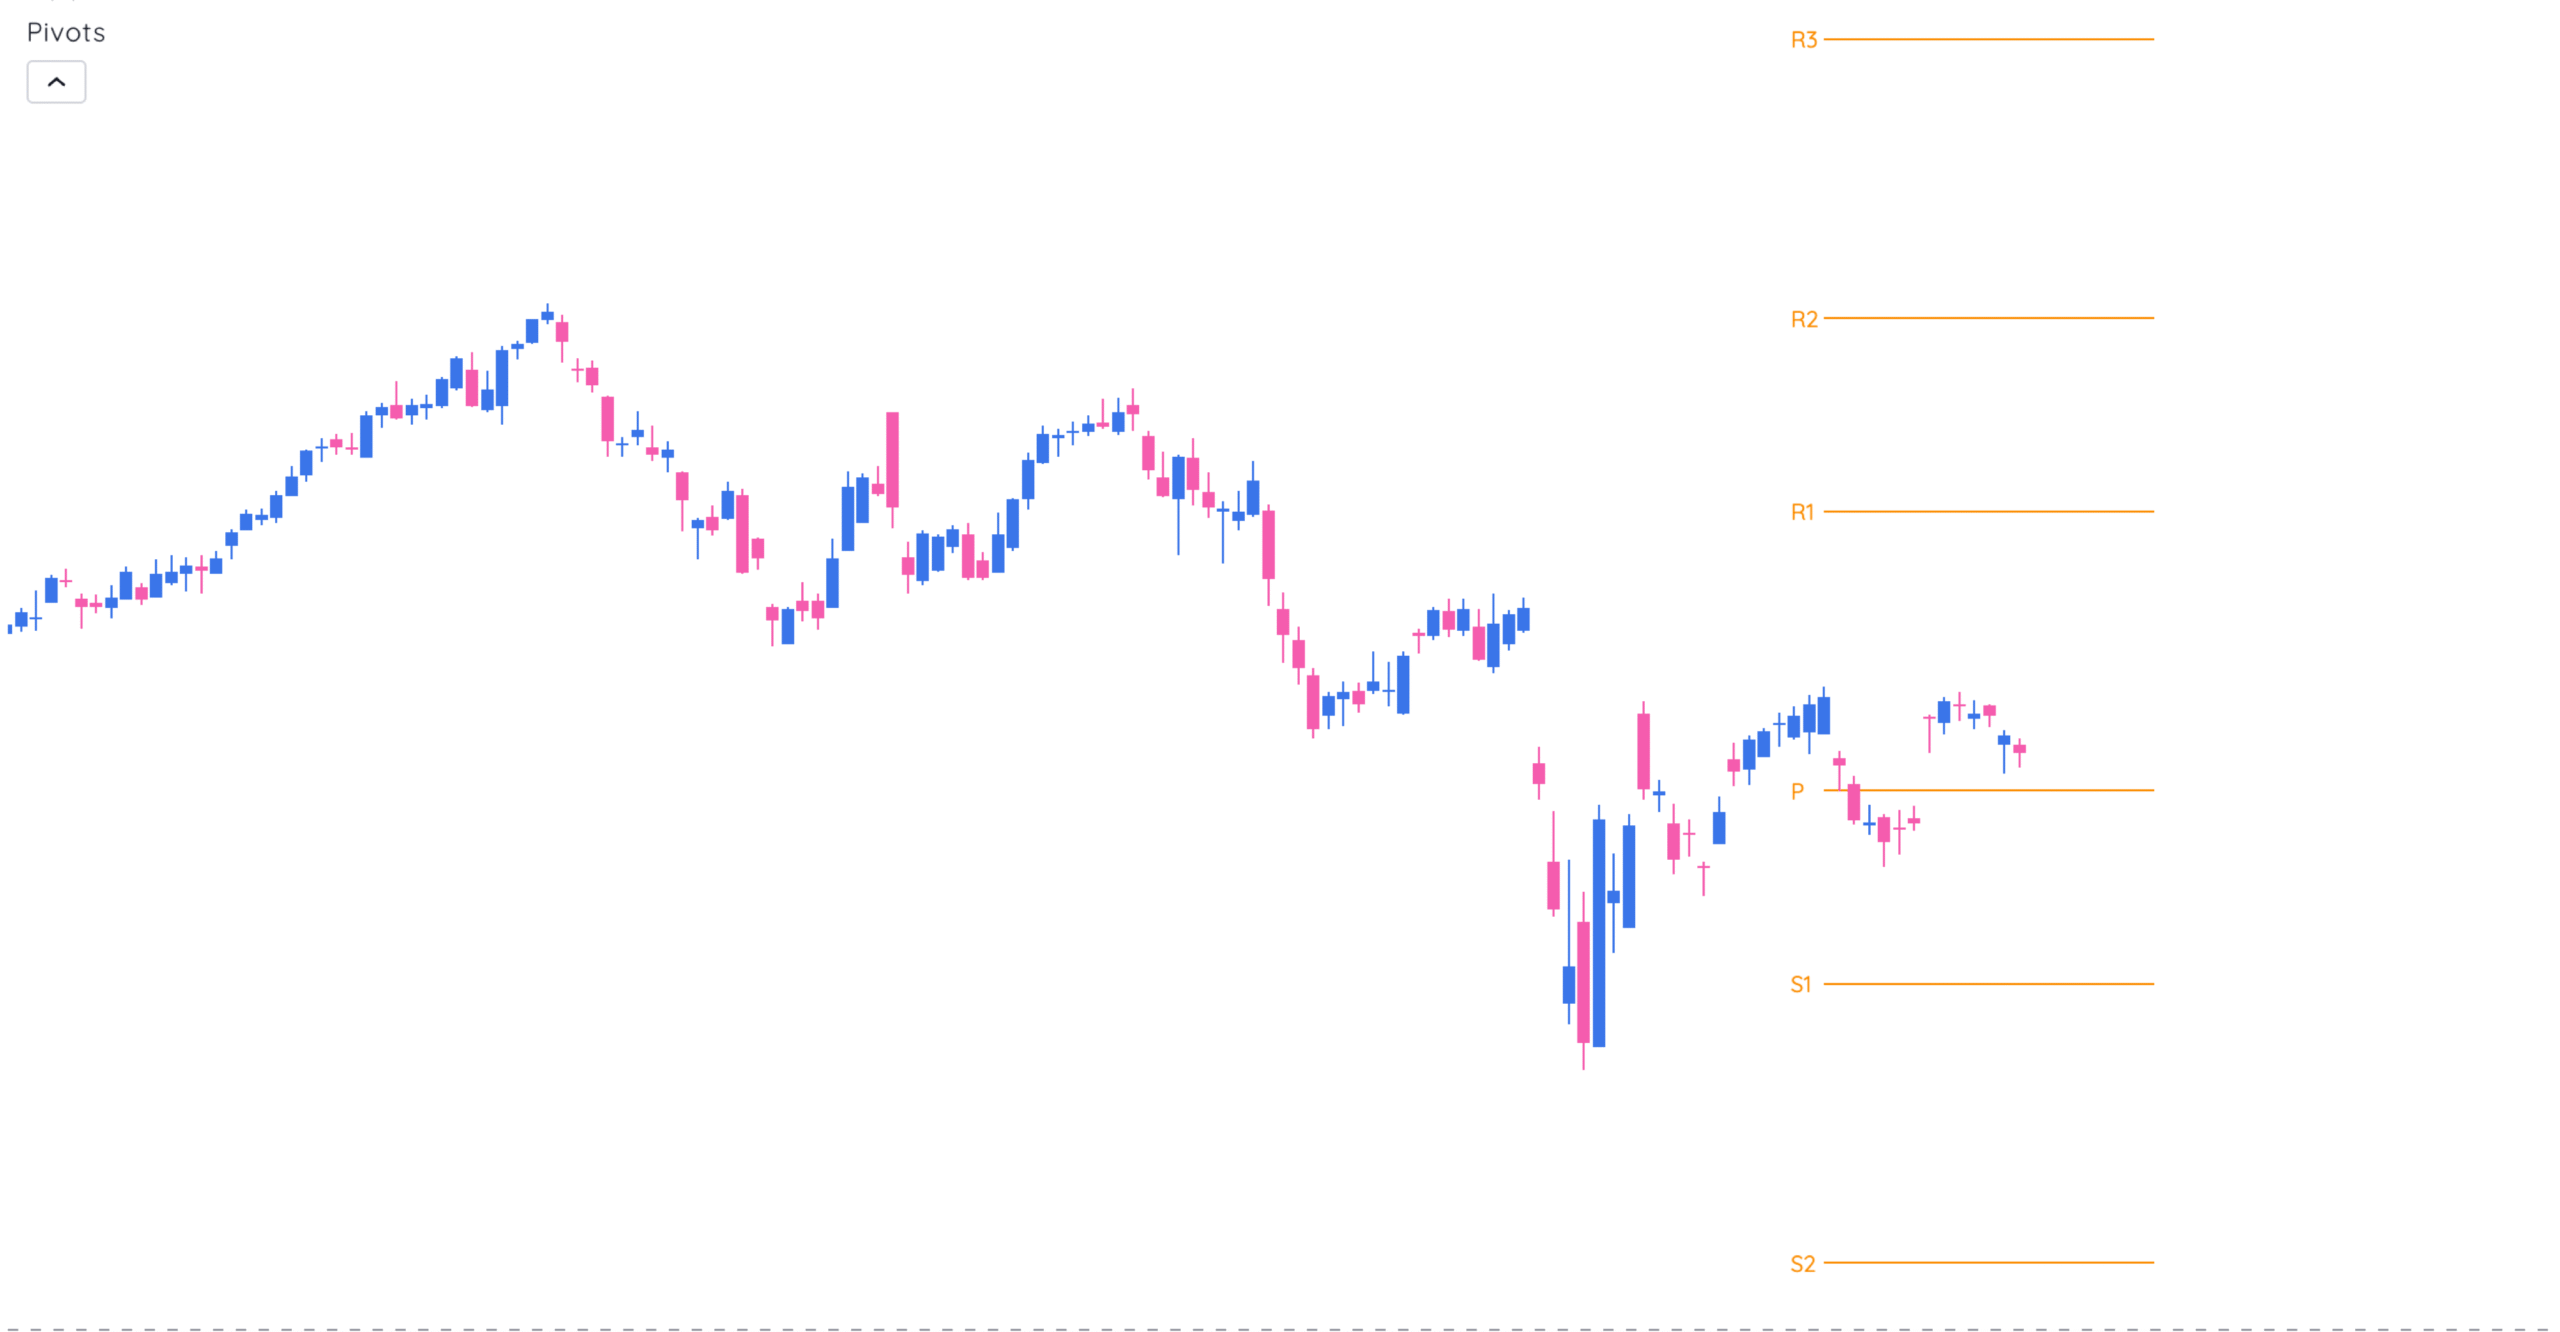
Take a look at the attached AAPL daily chart.
AAPL has been grinding sideways since its bounce in early April. Recently, it’s hovering just above the pivot level (P), struggling to break higher. That horizontal battle tells you bulls aren’t in full control—but bears haven’t taken it either.
Notice how price respected the pivot line like a magnet. Multiple candles test that level without conviction. No clean break above R1. No collapse to S1. Classic range-bound action, and perfect conditions for pivot trading.
When Pivot Points Work Best
- Sideways markets: Price respects defined levels.
- High-volume opens: The first 30 minutes often test the pivot.
- Intraday trading: Static levels give you a plan before the chaos starts.
When They Don’t
- Trending markets: Strong momentum can blast through multiple levels.
- High-volatility days: Expect false breakouts and fakeouts.
- News-driven sessions: Pivots won’t save you from a surprise earnings miss.
Enhancing Pivots With Other Indicators
Layer up with:
- Moving Averages: Confirm trend direction
- RSI or Stochastic: Help time reversals
- Volume: Confirms breakout strength
- Fibonacci Levels: Adds context to pivot rejections
Example: If RSI is oversold and price hits S1 with strong volume, you’re not buying the dip—you’re buying the setup.
Key Takeaways
- Pivot points are calculated, not guessed.
- They give clear intraday levels: pivot, two supports, two resistances.
- Use them for bias, entries, exits, and confirmations.
- Combine them with other tools—not as a crutch, but as a filter.


